Save to My DOJO
Table of contents
Building on our PowerCLI webinar, today we’re going to touch base on the vSphere Developer Center. A feature that was introduced in the web client back in 2019 with vSphere 6.7 Update 2 after its original release in the VMware Cloud on AWS Cloud Console.
It is available in the home pane of the vSphere Web Client and provides easy access to API documentation, SDKs, coding samples and more through a central location.
It offers a web-based API explorer as well as a code capture capability that will record all your actions and display the code in the language of your choice. Let’s dive in to see what it looks like!
Access the vSphere Developer Center
To access the developer center, head over to the home page of your vSphere Web Client and click on Developer Center.
It will give you an overview of what you can do with it, which is quite a lot!

vSphere Developer Center
Code Capture
The code capture capability lets you start a session that will record all your action and generate the code associated with it. While it is not really code that you would save in a .ps1 file and execute directly, it is incredibly useful to find out how to do a specific operation that you couldn’t figure out in PowerCLI or to simplify the creation of vRealize Operations (vRO) javascript scripts for instance.
Click on Code Capture and check Enable Code Capture to get it ready to record.
Note that Passwords and other sensitive data will not be recorded when starting a session.
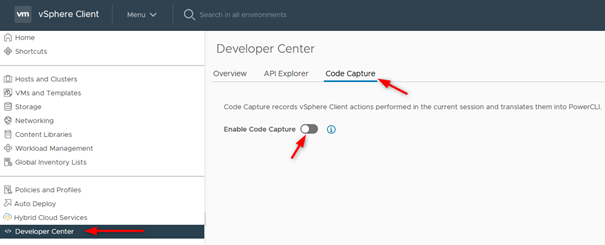
Developer Center Code Capture
You can then select a scripting language from the drop-down menu (PowerCLI, Javascript, Python, Go) on the right and click Start Recording to start the session.

Developer Center Recording
You will find that a red “recording” icon appeared at the top right when you enabled Code Capture. You can click on it anytime to start and stop the recording. Once you start it, a code window appears that will be populated with your actions.
After starting the session, I deployed a VM from template and customized it. I then stopped the recording to see the code it generated.

VM deployment
You will notice that it is much longer than what you would produce yourself as a human as it uses methods instead of cmdlets. (Note that the following screenshot is only the start of the script).
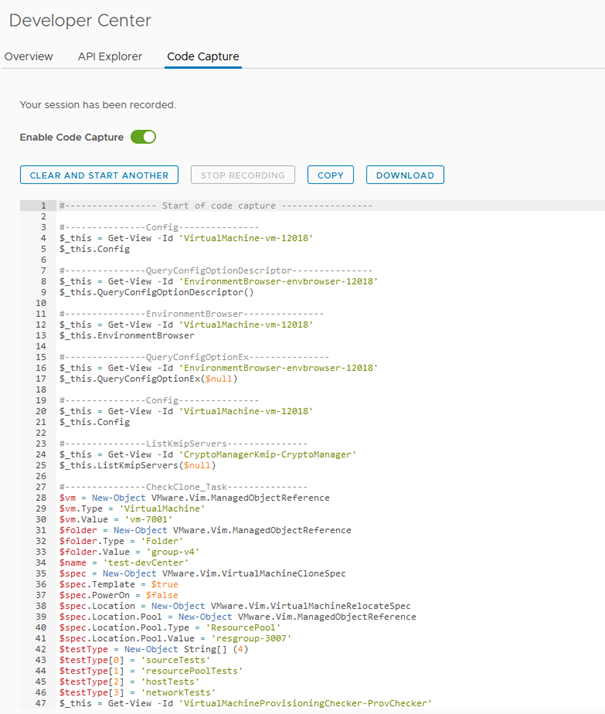
Developer Center cmdlets
API Explorer
The API Explorer feature allows you to browse through the API. You will find all the URIs, methods, parameters and such that you would need to interact with it.
You can also run API calls, be it POST, PUT, GET, DELETE… and obtain the result in the web UI.
When browsing the API, you can select which one to explore, for instance, you will find calls related to VCSA backup in “appliance” or Kubernetes namespaces actions in “vcenter” to name only two.
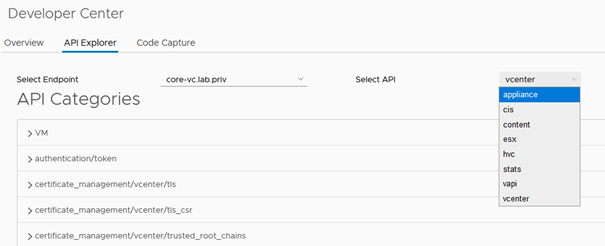
API Explorer
In the example below, I executed the Get call against /api/vcenter/datacenter to get the ID of the datacenter to query. Expand the query you’re interested in and click Execute.
I then find in the output that the ID is datacenter-3.
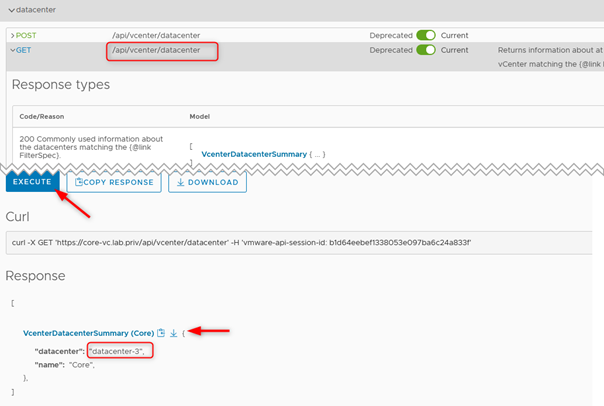
Datacenter Output
I can then use it in another API call that takes a datacenter parameter with {datacenter}.
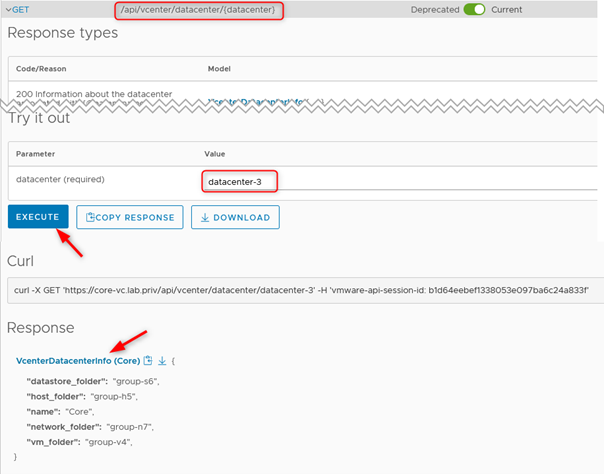
vSphere Developer Center Api Call
By clicking on the response link, you get the JSON output containing the information. This was obviously a slightly useless use case but it serves as an example to show how the API explorer works.
The interface is very well organized as you will find the different return codes and what they mean, the curl command to achieve this result…
Take away
While this feature won’t be used by some, it will be very much enjoyed by those that will have a use for it. No more scrolling through the online documentation or fishing for information in PowerCLI.
The increasing number of customers moving to an Infrastructure-as-Code approach will also benefit from such tools as it will render the use of API a lot more mainstream and accessible.
If you want to learn more about PowerCLI get our ebook PowerCLI – The Aspiring Automator’s Guide.


Not a DOJO Member yet?
Join thousands of other IT pros and receive a weekly roundup email with the latest content & updates!


