Save to My DOJO
Table of contents
Fighting VMware slow performance is probably one of the topmost ailments you’ll bump into as a virtualization admin. VMware performance problems are some of the hardest nuts to crack due to its multifaceted nature. Regardless, there are a number of things you can do to read the symptoms like ESXi slow disk access and such, you can then narrow down the cause and apply a fix if there is one.
Taking hints from this VMware KB, today we explore 10 ways to troubleshoot cases of VMware running slow. Have a look at this Altaro webinar for a more holistic approach to boosting VMware performance.
VMware Performance Monitoring
Before we move on, let’s revisit the Performance monitoring function embedded in the vSphere client. This is the first tool to resort to when examining VMware performance issues.
Figure 1 shows a performance chart with a VM’s virtual disk’s read and write latencies. The 7.5ms peaks observed are well within the acceptable range, however, sustained levels exceeding 10ms may indicates ESXi slow disk access or perhaps network congestion.
Use alarms wherever possible so you’re always on top of any performance issue. Alternatively, consider deploying vRealize Operations Manager for a more in-depth assessment of your environment.


Figure 1 – Performance graph for VM virtual disk read and write latencies
There is also an easy way of identifying heavy hitters in the graphs by stacking VM charts. In the Advanced monitoring tab of a host, click on chart options, select a metric you’re after, set the chart type to Stacked graph per VM and remove the ESXi host from the target objects list.

Figure 2 – Advanced chart options let you change how graphs are displayed. You can save the display for future use with the “Save Option As” at the top.
Once you click OK, you get a stacked graph which makes it easier to identify VM resources usage relative to each other.

Figure 3 – Stacked graphs are useful to get a view of overall resources consumption.
Note that it is recommended to use alarms wherever possible so you’re always on top of any VMware performance issue. Alternatively, consider deploying vRealize Operations Manager for a more in-depth assessment of your environment.
How to troubleshoot VMware slow performance
The steps, or rather, questions you should ask yourself, are listed in an orderly fashion starting with the most trivial.
Re-evaluate the performance of the affected VM after each step when you tried a fix. You can then choose to skip to the next step depending on the observed improvement, if any. If you come across something as glaringly obvious as a failed disk on a host, it goes without saying that you’d want to fix this first before moving on!
1 – Is it really unexpected behavior?
A VM subjected to a heavy workload can sometimes be perceived as performing poorly while it is actually fulfilling its purpose. Some examples are virtualized instances of SQL servers, processor-intensive or badly written SQL queries, it could also be mail servers with large user bases…
The VMware performance monitoring charts in the vSphere client will help you gauge resource utilization across a given period of time. You can then assess if the change in behavior was a one-off or an ongoing one and gauge whether the behavior is expected or not.
Products such as MS SQL and Exchange Server will, by design, take up any RAM thrown at them unless configured otherwise. What that in mind, it’s always a good idea to refer to the product’s documentation.
2 – Are you running the latest product?
Updates and new releases may address VMware performance issues in the form of ironed out bugs or improved drivers and code. Sometimes, however, the latest release could, in fact, make the problem even worse. Run the update in a test/dev environment or on a subset of your production before rolling it out across the board.
For instance, vSphere 7 Update 2 rolled out with a bug that would cause purple screens on hosts running ESXi on SD cards or USB drives. For major releases, it is recommended to wait until there’s a sufficient uptake in the community for updates and fixes to be released and benefit from a more stable product.
3 – Are your VMs running VMware Tools?
Making sure that the VMware Tools are installed, running and up to date on every VM that supports them is important in any environment. The VMware Tools package, above all, provides a set of optimized virtual device drivers that directly affect VMware performance (for the better usually).
Displaying VMTools in the vSphere Client
Again, using the vSphere client, you can easily check the status of VMware Tools in the environment as shown in Fig. 2. You must add the VMware Tools Versions Status and VMware Tools Running Status fields by clicking on the arrow of one of the fields header and checking them in the list.


Figure 4 – Displaying the VMtools status for VMs managed by vCenter Server
Displaying VMTools in PowerCLI
You can also use PowerCLI to gather information about the VMware Tools in your environment. If you are starting out with PowerCLI, check out our beginner’s guide and our ebook on the topic.
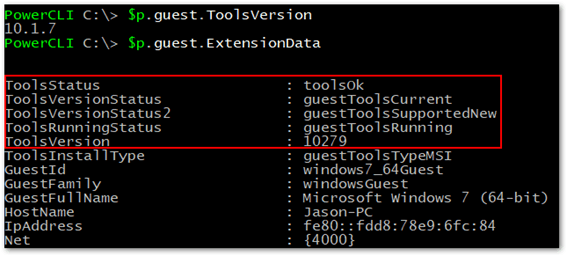
The quickest way to get the VMware Tools version is to use the ToolsVersion property of the Guest property.
![]()
Figure 5 – The “human readable” version of the tools is directly available in the guest property.
You can find additional details related to the VMware Tools <vm>.guest.extensiondata.


Figure 6 – Using PowerCLI to query the state of VMtools on VMs
4 – Are your VMs correctly sized in terms of resources?
In a vast array of environments, you will find sizing issues when it comes to virtual machines resource provisioning. Virtual machines running out of resources will suffer a variety of symptoms such as VMware running slow due to ESXi slow disk access, RAM swapping, you name it. If you see a resource regularly hitting 100% and you have verified that there is nothing wrong in the guest OS, it is probably a good idea to add more of said resource.
While diagnosing undersized VMs is fairly easy as you can see the graphs spiking regularly, on the other side, oversized VMs can cause just as much trouble and harm VMware performance.

Figure7 – vROPS can help you identify oversized and undersized VMs
The most common issue is when too many vCPU is provisioned. Although it may seem counter-intuitive, it might harm its performances and those of other VMs as the host’s vmkernel will have a hard time scheduling it on the physical cores while smaller VMs will easily get a free spot. If you want to learn more about this phenomenon, check out the co-stop CPU metric in esxtop.

Figure 8 – Impact on VMware performance is a side effect of oversized VMs.
As a rule of thumb, it is recommended to provision your virtual machines with minimal requirements and increase them as needed.
Identify sizing issues with vROPS
5 – Is your vCPU to physical core ratio too high?
This topic ties into the previous point about VM rightsizing. One of the big selling points of virtualization is the consolidation aspect of it. However, free CPU GHz is not the only metric to watch when provisioning VMs on a host.
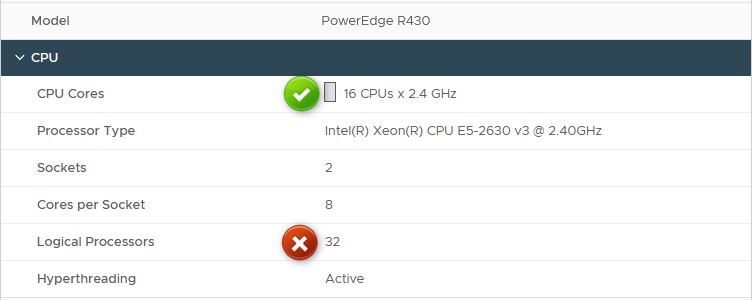
You also need to consider the ratio between the number of VM vCPU to physical CPU cores on the physical server. We call it vCPU:pCore ratio. vCPU refers to the number of cores provisioned on the VM (#Sockets x #CoresPerSocket). For instance, if you have 10 VMs with 4 vCPU each on a host equipped with 1 CPU sporting 12 cores, you get a vCPU:pCore ratio of 3.33:1 (40 / 12).
A ratio that is too high can lead to high CPU Ready % value and cause VMware performance issues.

Figure 9 – Don’t use hyperthreaded cores for the ratio
There is no one suitable value for this ratio as it will depend on the workloads you are running. The rule of thumb used to be 4:1 but I’m not sure it is a realistic value with nowadays more powerful processors as this makes for a rather poor consolidation ratio. Here are a few examples. Note that these are not official VMware recommendations.
-
- Mixed workloads: 6:1 – 7:1 will be fine in most case.
-
- Databases and other heavy hitters: 2:1 – 4:1 may be your limit to avoid bottlenecks.
-
- VDI workloads: 10:1 – 13:1 will suit VDI environments that support higher densities.
If you need to resort to higher ratios for some reason, you will need to try and ensure that the VMs running on the same host won’t be hitting it hard at the same time. The operational overhead is greater as you will have to resort to DRS rules, fine tune scheduled tasks, backup windows…
You can use PowerCLI to find the current ratio of a specific host.
| $VMHost = Get-VMHost “R430.lab.priv”
$VMCores = Get-VMHost R430.lab.priv | Get-VM | where powerstate -eq poweredon | Measure-Object -Property numcpu -sum write-host “$([math]::round($VMHost.NumCpu / $VMCores.sum,2)):1” |

Figure 10 – Find the CPU consolidation ratio in PowerCLI
If you notice your VMware running slow due such problems, reduce the ratio by moving some VMs to other hosts or powering down the least important ones. You can obviously also add capacity with extra nodes, CPUs…
6 – Is your underlying storage healthy?
Whether you’re using local, virtualized or SAN-based datastores, it all boils down to the performance and health of your disks and the underlying sub-systems housing them. Simply put, if VMs do not get their fair share of IOPS quickly enough, VMware performance will start degrading.
If there’s one storage metric to know it would be latency. You need to start troubleshooting when you observe latencies greater than 10ms. IOPS are also an important metric to ensure the storage backend is able to process all the requests.

Figure 11 – Storage latency can come from multiple components in the IO path
Here are a few things you can check and do:
Bad disks: Run regular health checks on your disk / networked storage and replace aging or failing disks immediately.
Latency / IOPS: Ensure that the IOPS are processed in a timely fashion. Anything above 10ms will mean there’s ESXi slow disk access going on. This can be due to a wide variety of reasons.
Snapshots: Delete any unused or redundant snapshots. Multiple snapshots can cause VMware slow performances. As a rule of thumb, you shouldn’t keep a snapshot more than 72 hours. And remember: A snapshot is not a backup! Use professional tools such as Altaro Backup instead.
Encryption: Use disk encryption only when necessary. Encryption = overheads = decreased VMware performance.
VM acceleration: If you have to make do with the current underlying storage and no other way to tackle ESXi slow disk access issues, consider resorting to host side caching.
7 – Do your ESXi hosts have enough resources?
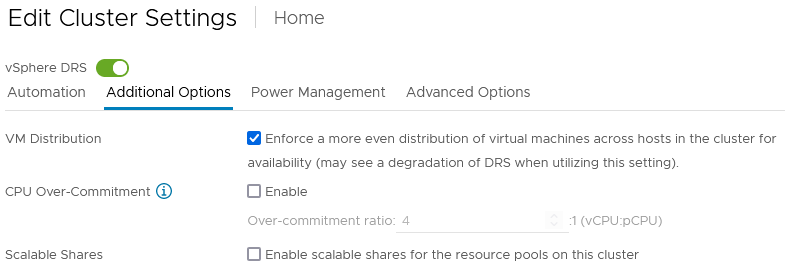
Running a dozen or so VMs configured with 16GB of RAM concurrently on a single ESXi host that has only 96GB of RAM is simply asking for trouble. Consider adding RAM to the host or use DRS – if you have multiple ESXi hosts and proper licensing – for better load distribution by enabling VM Distribution in the Additional Options of DRS.

Figure 12 – Enforce a more even distribution of virtual machines across hosts in the cluster for availability
Be aware that memory usage monitoring in the VMware performance charts doesn’t necessarily reflect reality. The active memory metric is an estimate based on sampled data and the consumed metric may be misleading due to Windows not releasing memory pages when they are no longer in use. Always favor in-guest monitoring agents for accurate memory metrics.
8 – Do you have CPU power management enabled?
CPU power management, when enabled on ESXi servers, may introduce latency that can be picked up by applications or workloads resulting in VMware slow performance. If you suspect this to be the case, do consult the vendor documentation on how to disable CPU power management. If disabling it has no effect, you may want to re-enable it in the spirit of running energy-friendly data centers.
You can either configure the CPU for maximum performance directly in the BIOS or set it to be managed by the OS. In which case you can configure the power management profile in vCenter.

Figure 13 – Power management can be set from within vCenter Server
9 – Is everything good on the networking front?
Make sure that your ESXi host networking does not become a bottleneck preventing VMs from running and operating optimally. Symptoms may include a slow response time when connecting to VMs via remote clients and management consoles, overly lengthy vMotion transfers and such.
Make sure that the network cards on your hosts are correctly configured. If your infrastructure permits it, separate management and workloads traffic. Run services such as management, vMotion and storage on their own dedicated network. Use optimized TCP/IP stacks and things like Jumbo frames where applicable. Make sure that the firmware and driver on any networking hardware thrown in the mix is up to date and in the VMware HCL. Finally, do not exclude issues with the virtual switches. Check your portgroups, VLAN assignment and so on.
It is recommended to use 10Gbps network cards where possible. However, if you have to prioritize, use these cards for iSCSI storage in priority, then vMotion, Backup and the rest of your workloads.
10 – Are you running appropriate Firmware/Driver versions?
Before you even call the support regarding VMware slow performance, you need to ensure that you are running the latest available Firmware and Driver versions. It is the first thing they’ll ask of you before even looking at the problem, and rightly as it solves a surprisingly vast majority of VMware performance problems.
It happens more often than not that someone forgets to update the firmware on a bunch of new servers before putting them in production. You then find out your vSphere hosts are running slow and realize you are rocking 3 years old buggy firmware versions.
vSphere 7 simplified the process of updating drivers and firmware with the Lifecycle Manager from within the vSphere client. Hyperconverged solutions such as DellEMC VXRail or Nutanix nodes also offer one-click upgrades that will take care of the whole process automatically.

Figure 14 – vSphere 7 lets you update firmware through a Hardware Support Manager (HSM)
If you don’t have access to either of these options, we recommend using the vendor’s server management tool such as Dell OME and always verify that the recommended versions to install are supported in the VMware Hardware Compatibility List (HCL).
Simplified Lifecycle Management in vSphere 7
Wrap Up
This pretty much sums today’s post on how to improve VMware performance. In various cases, you will also find yourself using esxtop to troubleshoot an issue so make sure to check out our esxtop guide. That said, this is not an exhaustive list as there will always be other factors causing VMware slow performance along with means to tackle them.
I suggest you read the material referenced in the links provided throughout this post and other posts, such as this one on App acceleration in vSphere 7 for more information. You can also visit the VMware Technology Network (VMTN) where you’ll find like-minded people sharing similar queries, problems, and potential solutions.
Finally, be sure to check out our dedicated ebook: vSphere Troubleshooting Guide by vExpert Ryan Birk


Not a DOJO Member yet?
Join thousands of other IT pros and receive a weekly roundup email with the latest content & updates!


