Save to My DOJO
RVTools is a free tool designed to help VMware administrators keep tabs on their virtual machines and other VMware resources. This handy tool displays granular virtual machine and infrastructure information in an easy to use, tabbed display.
Downloading and Installing RVTools
The RVTools installer is less than 6.5 MB in size, and then the installation process is completely straightforward. However, you will need to install version 4.6.1 or higher of the .NET framework before you install RVTools.
Connecting to Your Servers
Upon launching RVTools for the first time, you will see a message like the one shown in Figure 1. As you can see in the figure, RVTools lets you manage a single VMware host by entering its hostname or IP address, followed by your credentials. The tool can also be used to manage multiple hosts, so long as you have a vCenter Server. Simply enter your vCenter Server’s name or IP address.
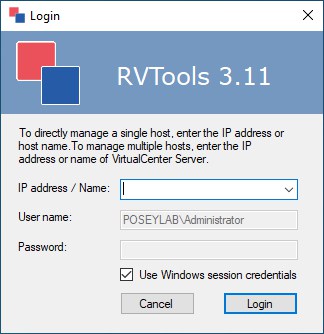
You can use RVTools to manage a single VMware host or multiple hosts.
Accessing Virtual Machine Information
Once you log into RVTools, you will be taken to the tool’s vInfo tab, which you can see in Figure 2. This tab displays all of your virtual machines, along with information such as the power state, connection state, and creation date of each VM.
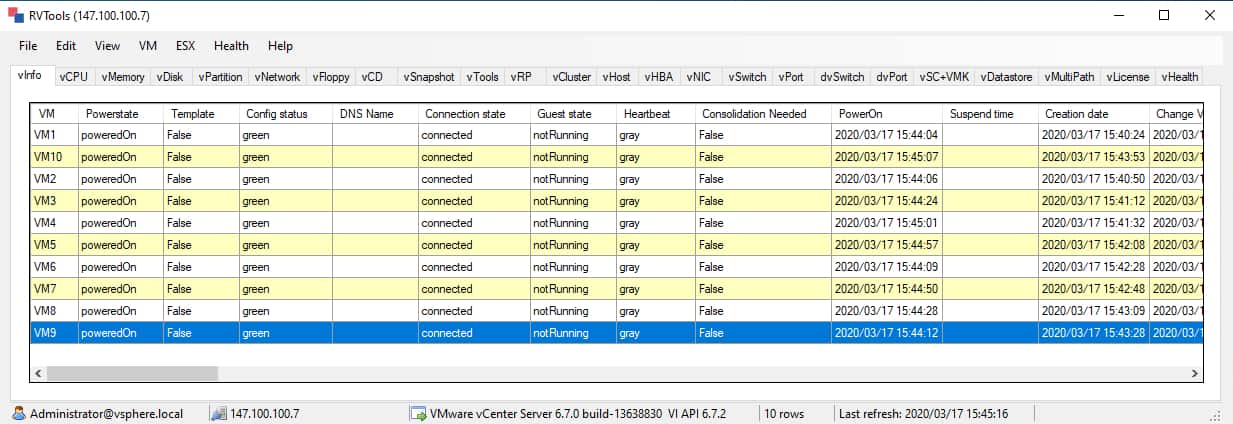
RVTools provides a summary of your virtual machines.
Keep in mind that the information shown in the figure is Read Only. You cannot use RVTools to change a VM’s power state, or to make changes to a VM.
You can access more detailed information about virtual machine hardware allocations on subsequent tabs such as vCPU, vMemory, vDisk, vPartition, vNetwork, vCD, and vFloppy. The vDisk tab for example, shown in Figure 3, provides detailed information about the size and configuration of each virtual machine’s virtual hard disks.
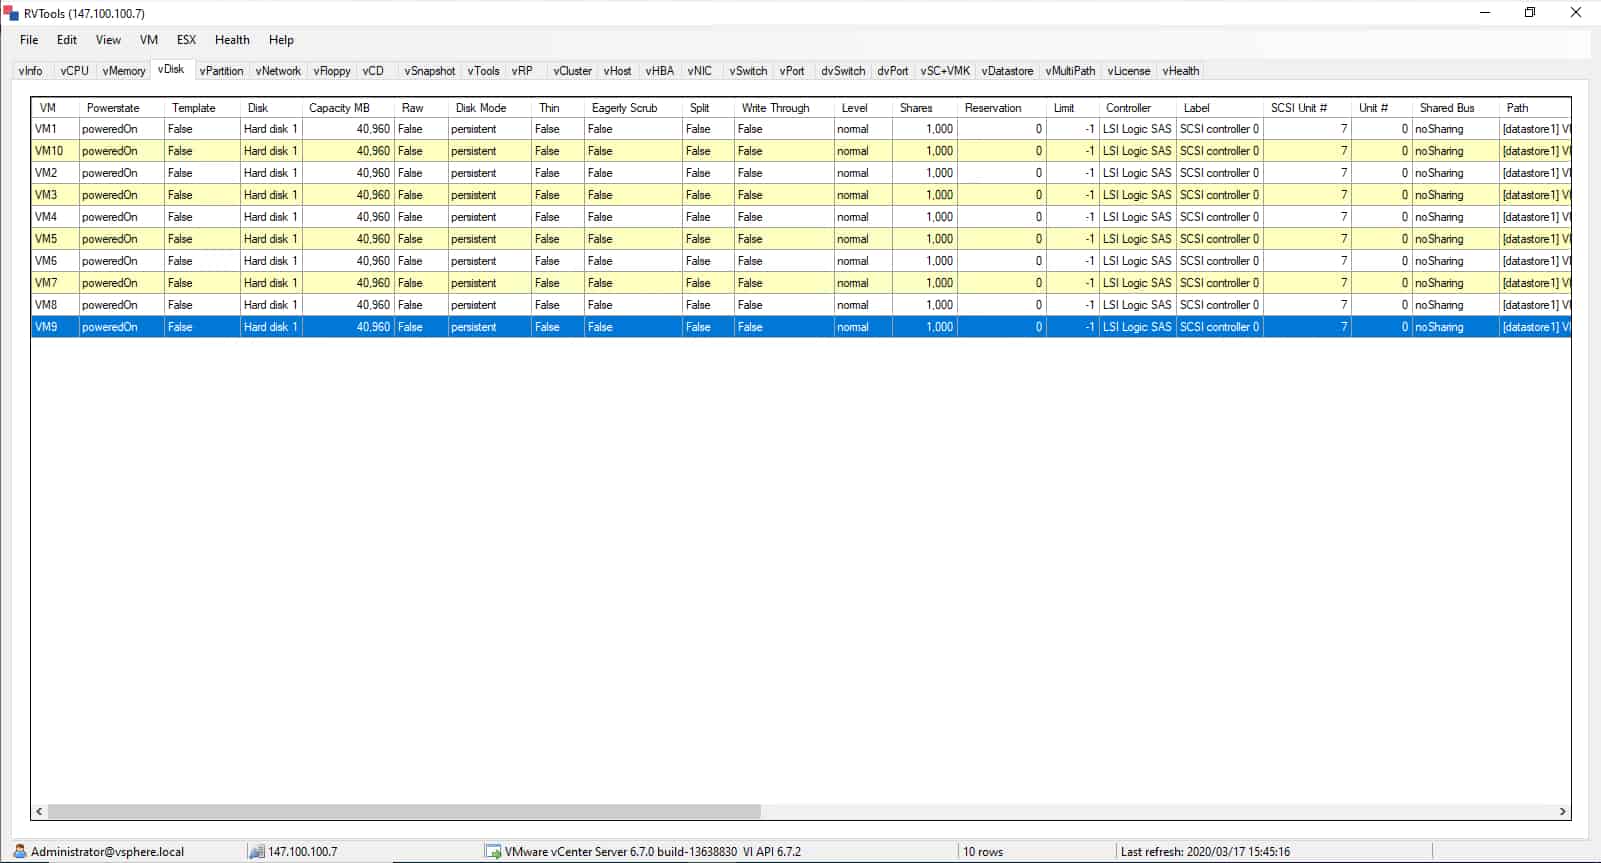
The vDisk tab shows detailed information about the virtual hard disks used by each VM.
Additional Use Cases
Even though RVTools is primarily a tool for displaying information about your virtual machines, it has additional capabilities. Some of its tabs can be used to display information about hosts, clusters, virtual switches, and other infrastructure components.
Information Filtering
As you may have noticed, Figures 2 and 3 were taken from a VMware host containing only 10 virtual machines. The small number of virtual machines makes it easy to locate a particular piece of information within the console. In the real world however, VMware deployments often include hundreds, or even thousands of virtual machines. In these types of environments, there are a couple of different things that you can do to make locating specific information easier.
One option is to simply click on a column header. Doing so will sort the virtual machines based on the data in the column that you clicked.
Another option is to create a filter. To do so, select the Filter option from the View menu. This will cause RVTools to display the dialog box shown in Figure 4. This dialog box allows you to filter the list of virtual machines based on whether they are powered on, powered off, or suspended. You can also filter the results by datacenter, cluster, or host, as well as by virtual machine (or template) name or by a custom field.
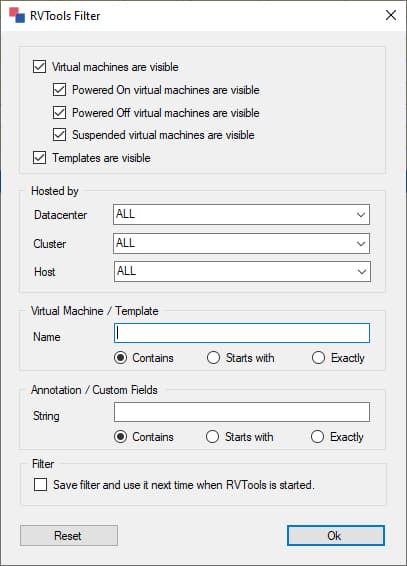
RVTools provides options for filtering the list of virtual machines.
Health Checks
As handy as RVTools may be for displaying virtual machine information, its most useful feature is its ability to perform health checks. Selecting the Properties command from the Health menu causes RVTools to display the dialog box shown in Figure 5. As you can see in the figure, this dialog box allows you to enable or to disable various health checks, and to set threshold values.
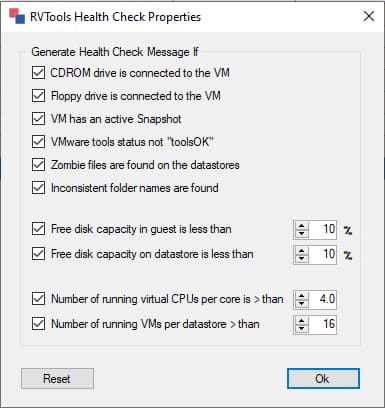
The RVTools Health Check Properties dialog box allows you to enable or to disable individual health checks.
Some of the things that health checks can look for include zombie files within the datastore, virtual machines that do not have the VMware Tools installed, or a virtual machine with inconsistent folder names.
Additionally, the dialog box lets you set four threshold values. These thresholds are used when checking guest storage capacity, datastore storage capacity, the number of virtual CPUs per physical core, and the number of running VMs per datastore.
To run a health check, click OK to close the RVTools Health Check Properties dialog box, and then select the Check command from the Health menu. You can see what the results of a health check look like in Figure 6.
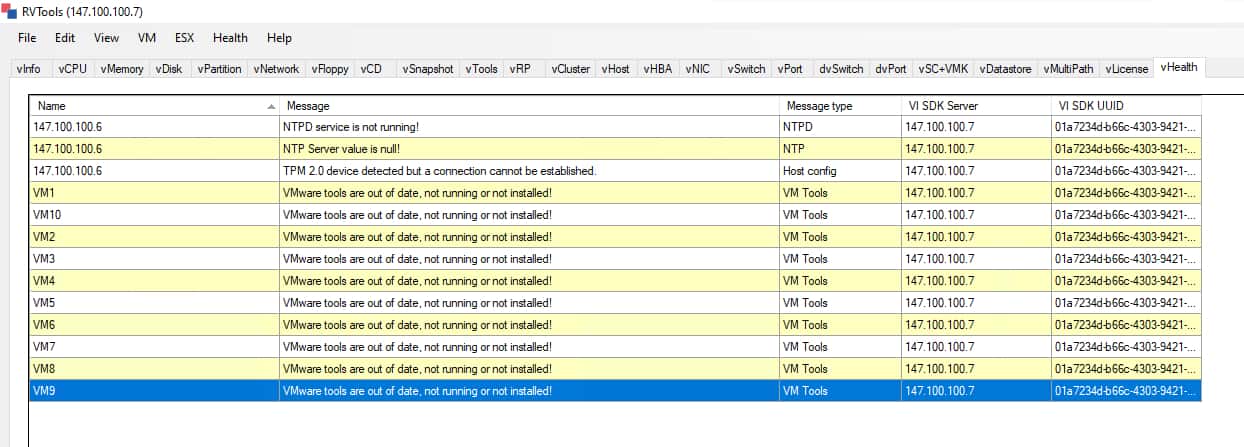
This is what it looks like when you run a health check.
Conclusion
So as you can see, RVTools is a great tool for gaining insight into your virtual machine’s resource usage, configuration, and health. Better still, RVTools is free, which makes it a great option for anyone who wants a lightweight tool for assessing the state of their VMware environment.


Not a DOJO Member yet?
Join thousands of other IT pros and receive a weekly roundup email with the latest content & updates!


6 thoughts on "How to Monitor Your VMs with RVTools"
how do i determine what are acceptable levels. Consumed Overhead? CPU usage
Hi Joe, I suggest the bible that comes straight from VMware: Performance Best Practices for VMware vSphere 7.0