Save to My DOJO
So before we dive into what this tool is and what it’s useful for, let’s talk about its origins. It was formerly called vCenter Operations Management Suite. Being that the tool does far more than just manage vCenter, I’m guessing VMware decided to do away with that old name and came up with vRealize. So prior to 2014, that’s what it was called. Good old marketing! This cloud management suite is made up of several components, including vRealize Automation, vRealize Operations, vRealize Log Insight and vRealize Business for Cloud.
Why use vRealize?
My students always ask me about why they should deploy this tool. If vRealize just points to vCenter, why not just look in vCenter for the details? This is the most common comment I get. My best analogy is that it’s like a consultant in your environment pro-actively monitoring things. Yes, you can manage and monitor through vCenter but the main issue is you have to know what to look for and manually set alarms. vCenter is more retroactive. With vRealize, it’s constantly looking for issues. If a virtual machine acts up and isn’t performing like it once was, you’ll know about it. Shoot, it will even tell you what’s wrong and how to go about fixing it!
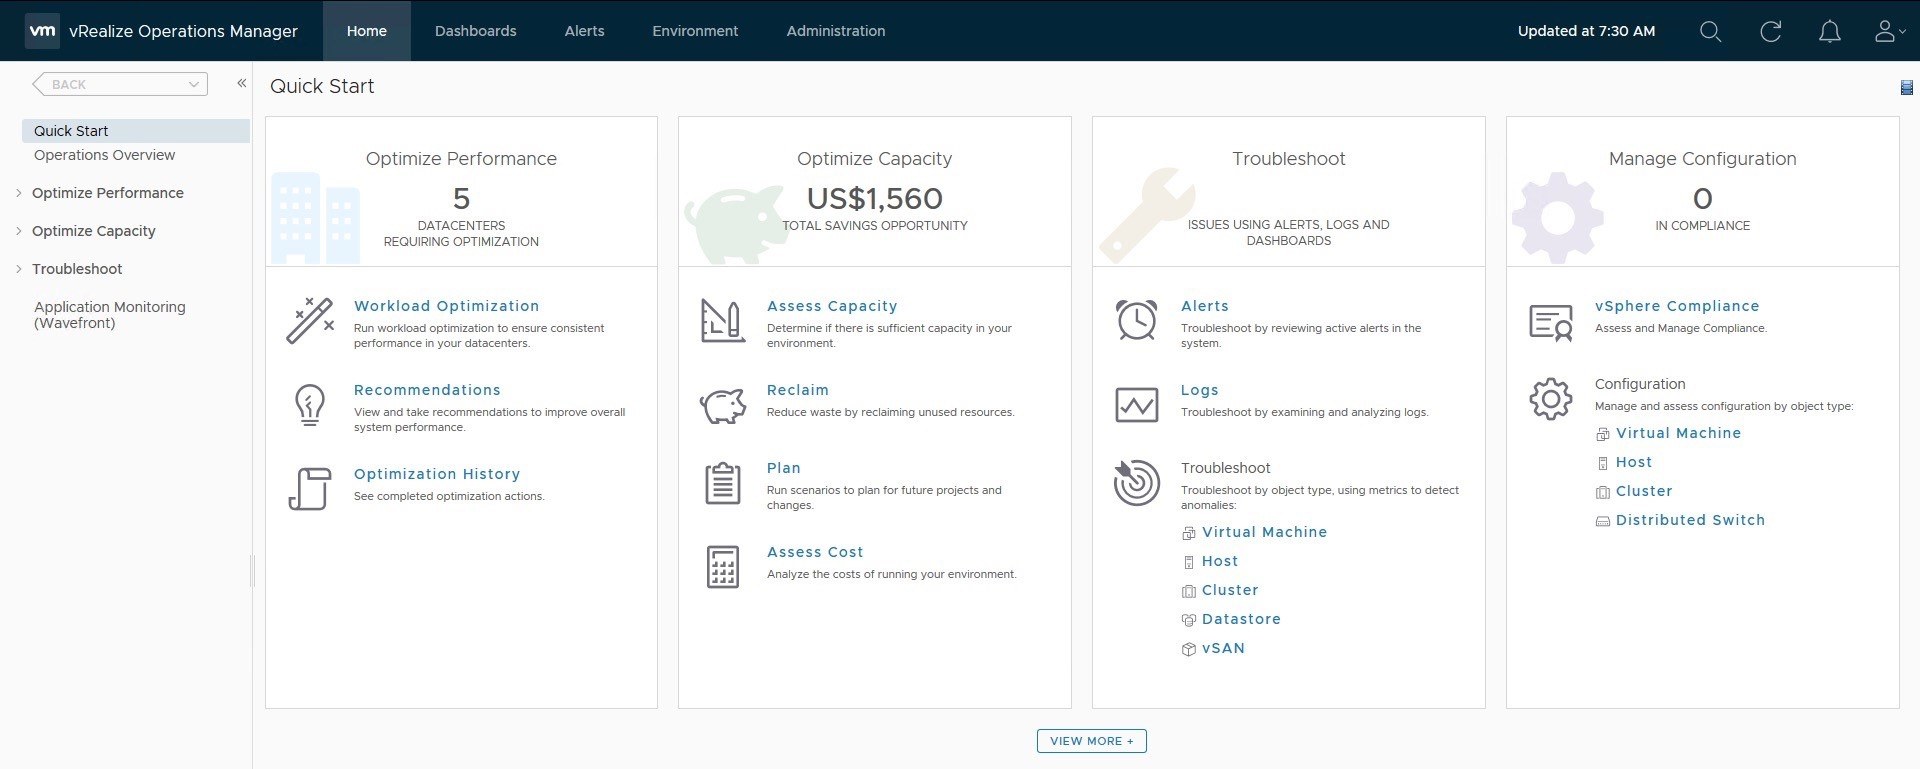
In the screen capture below, you can see at a high level what Operations Manager is trying to do. Optimizing environments is one of the best features and it also looks for savings opportunities, access capacity, and attempts to reclaim wasted resources, etc. If you think about how many people ask for VMs there is bound to be some kind of waste in your environment. VM sprawl is one of those negatives of virtualization. We’ve made it so easy to get our hands on new machines that we forget about the underlying resources that they need and consume. With vRealize you can plan and project resources for future projects. Additionally, if you’re having performance issues troubleshooting is built right in. You can monitor that VMs are staying within certain compliance levels as well!

There are three different editions of this platform: Standard Edition, Advanced Edition and Enterprise Edition. Standard Edition includes vRealize Operations, vRealize Log Insight and vRealize Business for Cloud. It’s definitely a solid buy for SMBs. Advanced Edition adds vRealize Automation and an enhanced version of vRealize Business for Cloud. Enterprise adds vRealize Automation for applications and application monitoring.
There are additional Add-ons as well that are worth mentioning. vRealize Code Stream, vRealize Orchestrator and vRealize Infrastructure Navigator. Code Stream is a pretty useful tool in itself. It allows you to automate the development and test of developer code in order to release it into production environments, tracks code artifacts, and versions. You create a pipeline that runs actions to build, deploy, test, and release your software. VMware Code Stream runs your software through each stage of the pipeline until it is ready to be released to production.
There are some GREAT dashboards in vRealize as well. If you’ve got the product in front of you, you can click through and see some of them. I’ll list some of my favorites below. The dashboards are probably my favorite feature of the product.
Operations Overview
This dashboard provides an overview of your virtual data centers, clusters, hosts, and datastores. It breaks down this overview by showing you the number of running virtual machines vs. powered-off virtual machines. You’ll notice a “Top-15” that might be experiencing performance issues.
Troubleshooting
If you have a problem in your datacenter, this is a great place to go. It will show specific hosts and look at stress, overall health, and recommendations on how to fix them. Like I said above, it’s a consultant!
vSAN
If you use vSAN these are a must. It will monitor the cluster, hosts, cache disks, capacity disks, VMs running on vSAN, overall IOPs and latency!
Application
From an application standpoint, after the 6.6 release, you can now have application-specific dashboards. You are able to drill down into the application and monitor performance. So it’s great for tier-1 applications.
Capacity Overview
This is where you are going to drill down into specific infrastructure resources like the CPU capacity, memory capacity, storage capacity, and more. It also allows you to see if you have a reclaimable capacity.
Heavy Hitter VMs
This one is great. If you have large machines, they’ll show up on this dashboard. Heavy Hitter VMs. You can look at CPU demand and memory demand for your largest machines.
Wrap Up
To wrap up, this tool is far more than just a monitoring tool. Forecasting comes in useful if your environment is growing quickly and you need to gauge just how much additional hardware will cost in the future. I love the proactive nature of this tool! Sometimes I’ve heard people say it’s TMI (Too Much Information) but I’m not sure I’d agree with that. As your environment gets bigger it becomes harder to troubleshoot and vRealize Suite helps you manage it effectively.
What about you? Have you used this suite of tools to your advantage? Have you tried it and found it too much? Let us know in the comments section below!
[the_ad id=”4738″][thrive_leads id=’18673′]


Not a DOJO Member yet?
Join thousands of other IT pros and receive a weekly roundup email with the latest content & updates!


