Save to My DOJO
Table of contents
With vSphere comes a very handy tool, called ESXTOP, which is great for helping IT Pros pinpoint performance issues quickly. It is a command-line tool that can be used to collect data and
provide real-time information on the resource usage of a vSphere environment such as CPU, disk, memory, and network usage. For the Linux gurus, ESXTOP is essentially VMware’s version of the Linux command-line tool called TOP. Check out Part 2 of the guide here.
How to Access ESXTOP
ESXTOP can be accessed through the ESXi console or remotely using a Secure Shell session. The syntax is simple, type the following command to access ESXTOP:
esxtop
You will immediately be taken to the interactive display mode.
ESXTOP can be run in the following three modes:
Interactive – This displays the collected performance information and displays it in real-time. It is the default mode of ESXTOP and the stats displayed are updated every 5 seconds by default.
Batch – Collects the performance data and saves it to a file. This is useful for collecting statistics for a long period of time to use for later to analyze. Data collected can be analyzed using tools like Excel, Perfmon, and other 3rd party tools.
Replay –Interactively replays the data that was collected when using the VM-Support tool. This is a tool that is commonly used to capture logs and config data to send to VMware Support. One important thing to note is that you cannot interactively replay data the collected from using batch mode.
Using Interactive Mode
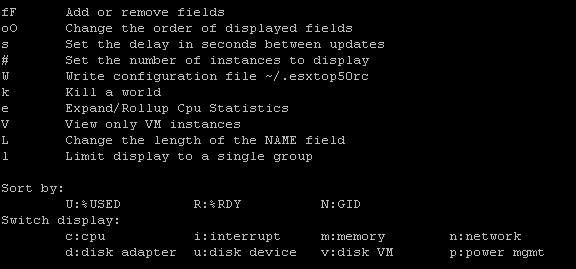
Since interactive mode is the default used by ESXTOP, you don’t have to specify any extra commands to get into this mode, simply type ESXTOP without any addition switches and your in “Interactive” mode. A good way to find your way around in interactive mode is by pressing “h”, this will give you a menu of the various commands available:

Use “h” to help you find your away around Interactive Mode.
Notice the “Switch Display” section which lists the different display options that are available. These options listed allow us to switch between the different resources that we would like to view. For example, let’s say we want to take a look at the resources on our disk adapters, the “Switch Display” section shows that “d” is the command to switch to the disk adapter display so we simply type in “d”:

ESXTOP displays real time performance stats on the Display Adapters.
We now get a real-time display of the resource stats for our display adapters. This can be a lot of information to view all at one time, so if we wanted to we could remove a few of the columns that we aren’t interested in looking at. To do this simply use the “f” command:

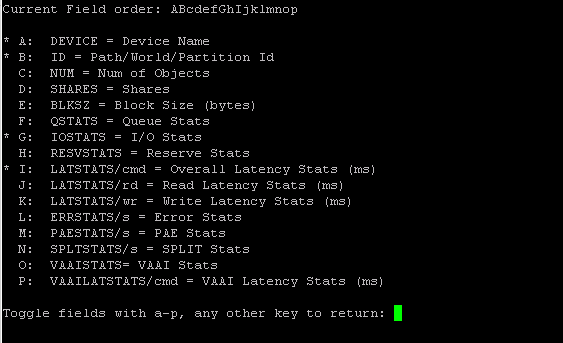
Filter out unwanted fields to simplify your view or add additional fields to get more information.
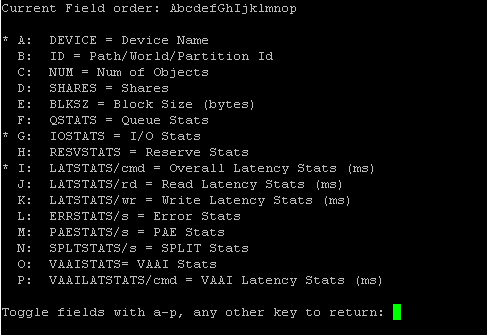
Now we get a list of all the available fields that we can add or remove. The items that have an asterisk symbol (*) next to them are the ones that are actively displayed at the moment. To remove or add them simply type in the corresponding letter. So for example, lets remove the “ID” field from our display by pressing “b”:

Input the associated letter to remove/display a field.
The asterisk symbol is removed and we press any other key besides A-P to return to the display view. We can now see that the ID column is gone:

Path/World/Partition field is no longer visible.
If we want, we can even save this modified view for the next time we access interactive mode. To do this simply press “W” (make sure it’s a upper case) to save the settings. Also, we could alternatively save the settings to another file name in case we’d like to have a separate customized view from the default. In the example below, I am saving the view as esxtopdiskview, if we wanted to overwrite the default we would simply leave the field blank:

Create a custom config file or save over the default.
To use our custom config file with ESXTOP use the following syntax:
Esxtop –c .\esxtopdiskview
To quit esxtop simply input the letter “q”.
Using ESXTOP in Batch Mode
To use batch mode, simply open ESXTOP with the –b switch. Also, include the –n switch to specify the amount of iterations we’d like to run. An iteration is a snapshot of the performance stats. The default delay time in between each iteration is 5 seconds. If we wanted to change this setting, we would use the –d switch followed by the amount of seconds to wait till data is collected again. So, if we wanted to gather performance data for 50 seconds and save it to a CSV file the syntax would look like the following :
Esxtop –b –n 10 > esxdata.csv
![]()
The data will be collected and saved to the specified CSV, which we can review later for analysis. Also be aware of the amount of space that this can consume. You can also compress the data that is collected to save space by using the following syntax:
ESXTOP –b –n 10 | gzip -9c > esxdata.csv.gz
![]()
Also, if we wanted to only collect the data from our custom config file that we created earlier, we can specify the config file using the –c switch:
Esxtop –b –n 10 –c .\esxtopdiskview | gzip -9c > esxdata.csv.gz
![]()
Be sure to check out part 2 where we will go over how to use Replay mode and what common ESXTOP stats to watch when troubleshooting performance.
Wrap-Up
When troubleshooting performance issues in vSphere, the above tools and tricks can be immensely helpful, so don’t forget about it, when you find yourself in a troubleshooting situation.
How about you? What are your favorite tools and methods for troubleshooting vSphere performance issues? Feel free to let us know in the comments section below!
Thanks for reading!
[the_ad id=”4738″][the_ad id=”4796″]


Not a DOJO Member yet?
Join thousands of other IT pros and receive a weekly roundup email with the latest content & updates!


32 thoughts on "Introduction to ESXTOP Part 1"
Very helpful site