Save to My DOJO
New Webinar: Sharpen your VMware vSphere Troubleshooting skills with Ryan Birk & Andy Syrewicze. Save your seat here!
_______________________________________________
In a recent article, I described VMware’s DRS and how it complements another cluster centric feature, VMware High Availability (HA), the subject of today’s post. The primary purpose of HA is to restart virtual machines on a healthy host, should the one they reside on suddenly fail. HA will also monitor virtual machines at the guest’s operating system and application level by polling heartbeats generated by the VMware Tools agent installed on monitored vms.
Better still, enabling HA on your cluster unlocks Fault-Tolerance (FT) the functionality of which has been greatly beefed up in vSphere 6, effectively making it a viable inclusion in any business continuity plan. Having said that, FT is somewhat stringent on the requirements side of things making its adoption a tough sell for SMEs and similar. Another thing to keep in mind is that FT will only offer protection at the host level. If application level protection is what you’re after, then you’d be better off using something like MSCS. I’ll cover this in more detail in an upcoming article on FT.
At this point I feel that I should also clarify that contrary to popular belief, HA does not provide or guarantee a 100% uptime or anything close for that matter. The only one certainty is that when a host hits the dust, so will the vms residing on it. There will be downtime. If set up correctly, HA will spawn said vms elsewhere in your cluster after approximately 30 seconds. While 100% uptime is an impossible ideal to achieve, HA coupled with FT are both options you should be considering if improving uptime metrics is your goal.
For demonstrational purposes, I’ll be using a vSphere 6.0 two-node HA enabled cluster. Keep in mind that you’ll also need to have ESXi hosts access the same shared-storage on which the virtual machine files reside. Have a look here for a complete checklist of HA pre-requisites.
How does HA work?
When HA is enabled, a couple of things occur. Firstly, an HA agent is installed on each host in the cluster after which they start communicating with one another. Secondly, an election process (Figure 1) selects a host from the cluster to be the Master, chosen using criteria such as the total number of mounted datastores. Once a Master is elected, the remaining hosts are designated as slaves. Should the Master go offline, a new election takes place and a new Master is elected.
Figure 1 – HA election in progress
The main task of the Master is to periodically poll vCenter Server, pulling state information for the slave hosts and protected virtual machines. If a host failure occurs, the Master uses network and datastore heartbeating to verify that a slave has in fact failed. This 2-factor monitoring method ascertains that a slave has really failed and not simply ended up being partitioned (unreachable but still exchanging datastore heartbeats) or isolated (slave fails to contact other HA agents and network isolation address).
It is important that you select at least two datastores (Figure 2) when setting up “Datastore heartbeating” from “vSphere HA”. You’d still be able to set up HA using only one datastore but for added redundancy VMware suggest that you specify a minimum of two datastores. You should also note that you cannot include VSAN datastores.
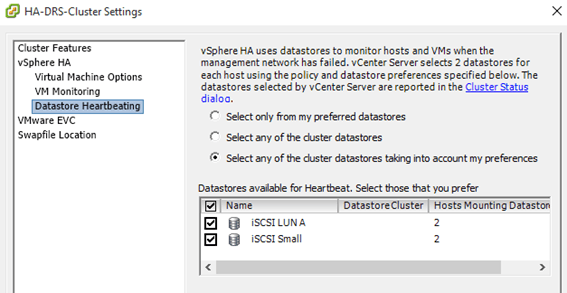
Figure 2 – Selecting datastores for host monitoring
How do I enable it?
Well, as with most other features, enabling HA on a cluster is a piece of cake! If you’re using vSphere client, change the view to “Hosts and Clusters”, right-click on the cluster name, select “Cluster Features” and click on the “Turn On vSphere HA” check-box (Figure 3). Next, select “vSphere HA” and make sure that the “Enable Host Monitoring” check-box is selected (Figure 4). Click OK and you’re done.
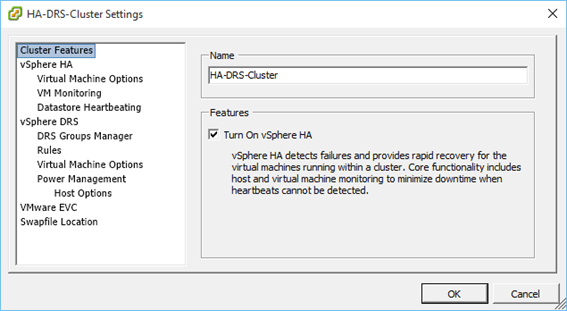
Figure 3 – Turning on HA for a cluster (using the C# vSphere Client)

Figure 4 – Enabling Host monitoring (using the C# vSphere Client)
If instead you’re using vSphere Web client, you’ll need to navigate to “Clusters” and highlight the cluster name in the Navigator pane. In the right pane, switch to the “Settings” tab, highlight “vSphere HA” and click the Edit button. Click on the “Turn on vSphere HA” to enable HA for the cluster. Similarly, you’ll see that the “Host Monitoring” option is enabled by default (Figures 5-6).
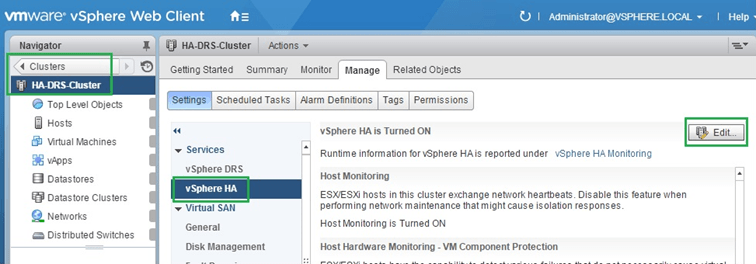
Figure 5 – Turning on HA and Host monitoring on a cluster (using the vSphere Web Client)
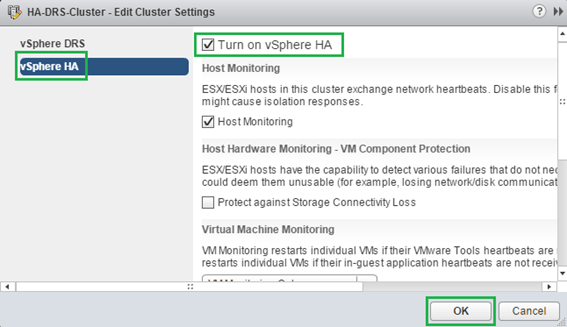
Figure 6 – Turning on HA and Host monitoring on a cluster (using the vSphere Web Client)
By simply enabling HA and sticking to the default settings, you are guaranteed that in the event of a host failure, the virtual machines on a failed host are automatically powered up elsewhere.
Fine-Tuning HA
There are three types of failure scenarios these being Failure, Host Isolation and Cluster Partitioning. In all instances, virtual machine behavior can be managed accordingly.
Host monitoring
Host monitoring is turned on and off by clicking the “Enable Host Monitoring” check box under “vSphere HA” (Figure 4 above). It is important that you unselect the setting whenever you carry our network maintenance to avoid false isolation responses.
Host failure can result from a number of issues including hardware or power failure, network changes planned or otherwise and even a crashed ESXi instance (PSOD). A complete failure is deemed such whenever a host cannot be reached over any of the environment’s network and storage paths. When this happens, the Master performs an ICMP test over the management network. If the suspect host does not respond, the Master will check for any signs of datastore activity from the host’s part. When both monitoring methods fail, any vms running on the failed host are assumed dead and restarted on any of the alternative hosts in the cluster.
Admission control
Admission control is the process by which HA monitors and manages spare resource capacity in a cluster.
The default “Admission Control” setting found under “vSphere HA” is set to ignore availability constraints. In other words, HA will try to power on vms regardless of capacity. This is generally not a good idea and you should follow the best practices for admission control listed here. For instance, since I only have 2 nodes in my cluster, I set the number of “Host failures the cluster tolerates” to 1. Setting in to 2, will result in the following warning (Figure 7), something to be expected.

Figure 7- HA insufficient resources warning
Alternatively, you can set aside a percentage of CPU and Memory cluster resource as spare capacity for fail-over purposes or simply specify which hosts are designated for fail-over (Figure 8).
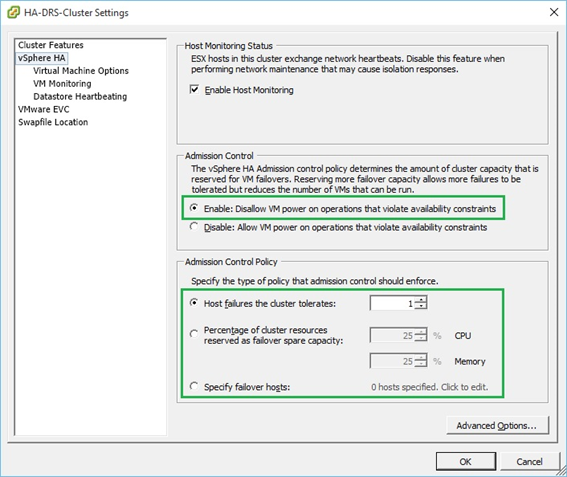
Figure 8 – Configuring HA Admission Control
VM Behavior
You can control the behavior of virtual machines by modifying the settings under “vSphere HA -> Virtual Machines Options” as shown in Figure 9. The “VM restart priority” level determines the order by which resources are allocated to a vm once it is restarted on an alternate host. The “Host Isolation response” setting on the other hand, specifies what happens to a virtual machine once a host becomes isolated. The settings enforced by the cluster-wide policy can be overridden on a per vm basis. In the example shown below, I’ve disabled “VM Restart Priority” for Win2008-C. In this case, the vm remains where it is if and when its parent host fails. Similarly, if the host is isolated, Win2008-C will shut down instead of keeping on running as specified by the cluster policy.
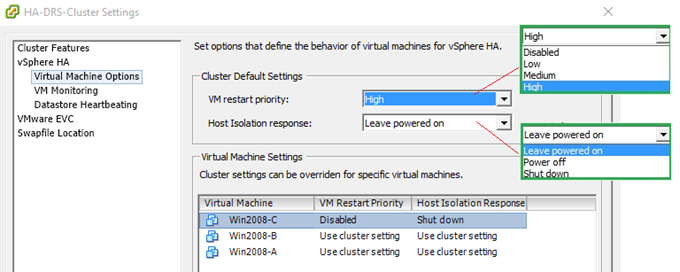
Figure 9 – Setting virtual machines options
VM Monitoring
HA monitors virtual machines at the OS and at the application level provided the application being monitored supports VMware Application Monitoring or has been modified via an SDK to generate customized heartbeats. In both cases, HA will restart the vm if it is no longer receiving heartbeats from it. HA will also monitor a vm’s disk I/O activity before rebooting it. If no disk activity has been observed during the “Failure Interval” period (Figure 10), HA will reboot the vm. After the vm reboots, HA will wait a “minimum uptime” number of seconds before it resumes monitoring to allow enough time ffor the OS and vmtools to properly initialize and resume normal operations. Failing this the, the vm may end up being rebooted needlessly. As an added precaution, the “Maximum per-VM resets” limits the number of successive reboots withing a time frame governed by the “Maximum resets time window” setting. As per previous settings, both VM and Application monitoring can be set on an individual basis by ticking on the “Custom” checkbox next to the “Monitoring sensitivity” slider.
The default settings are as follows:
| Failure Interval (seconds) | Minimum Uptime (seconds) | Maximum per-VM resets | Maximum resets time window | |
| Low | 120 | 480 | 3 | 7 days |
| Medium | 60 | 240 | 3 | 24 hours |
| High | 30 | 120 | 3 | 1 hr |
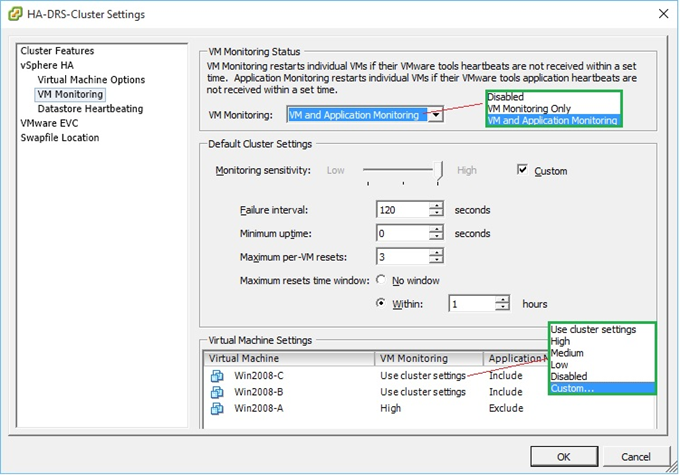
Figure 10 – Setting vm monitoring options
VM Component Protection
When a host fails to contact any other agents running in the cluster, it tries to reach what is called a network isolation address which by default is set to the default gateway configured on the host. If the latter fails as well the host declares itself isolated. When this happens, the Master keeps monitoring vms on the isolated host and will restart them if it observes that they are being powered off. Sometimes though very rarely, a situation called split-brain may arise where two instances of the same vm are both online. Even so, one instance only will have read and write access to the vmdk files. This scenario occurs when the Master, using datastore heartbeats, fails to determine whether a host is isolated or partitioned and consequently powers up the same vms on another host. To prevent this from happening, use the vSphere Web Client and enable VM Component Protection as shown in Figure 11. Further details on how to set this is up are available here on pgs. 19-20.
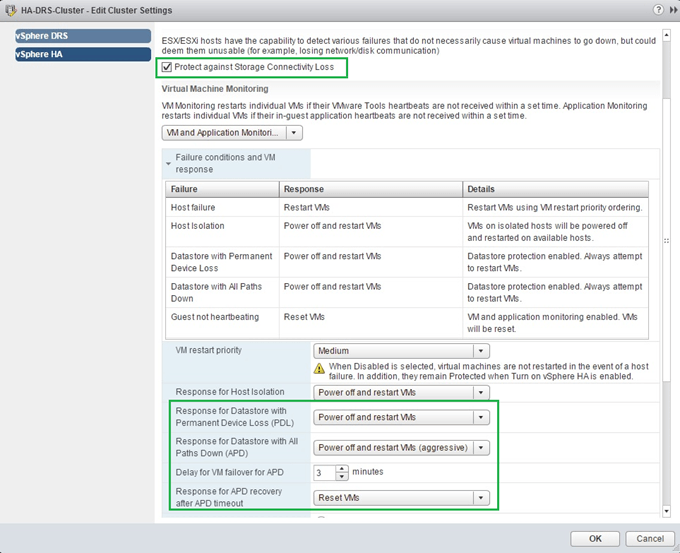
Figure 11 – Configuring PDL and APD settings using the vSphere Web Client
Monitoring HA
When you select the cluster name in vSphere Client and switch to the summary tab, you should see a “vSphere HA” information window displaying some HA metric and status in accordance with the settings you specified. In addition there are 2 links at the bottom of the window named “Cluster Status” and “Configuration Issues” respectively. Clicking them provides some further details about the HA status and setup (Figure 13-15).
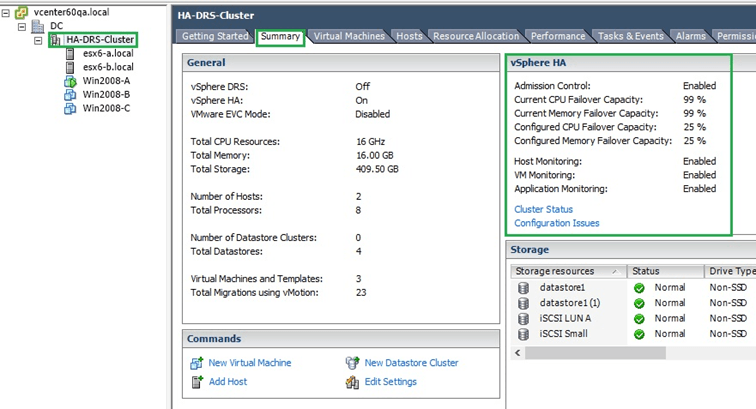
Figure 12 – HA metrics and status window
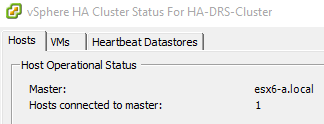 Figure 13 – HA Host operation status |
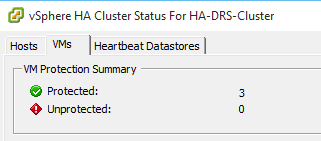 Figure 14 – HA vm protection status |
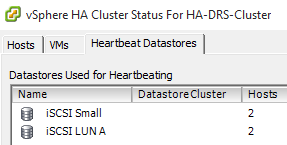 Figure 15 – HA designated datastores |
Conclusions
I hopefully covered most of the important stuff you need to know about HA. When enabling HA and DRS on the same cluster, which you’ll probably do, you will need to keep track of any affinity rules you might have set up and how these might conflict with HA settings. Ideally you should test any change you plan on introducing prior to going live with it. The last thing you’d want is to have vms power off or reboot unexpectedly in the middle of the night. Host monitoring on its own is a great thing to have as it provides yet another layer of high availability to your infrastructure. VM and application monitoring overlays another layer of protection but for reasons already mentioned be sure to tread carefully before implementing VM / App monitoring all across the board. I’ll probably cover fault tolerance some other time where I’ll show how it can further raise the HA bar.
If you need further details on HA make sure to visit here.
[the_ad id=”4738″][the_ad id=”4796″]


Not a DOJO Member yet?
Join thousands of other IT pros and receive a weekly roundup email with the latest content & updates!


4 thoughts on "Setting up VMware High Availability on a vSphere Cluster"
Jason,
Great write-up. I wasn’t able to read all of it yet, but I skimmed it (on a flight and only have a little time left on the wifi). I am the PM for HA/DRS at VMware. Glad to see you showed part how to setup the basis of HA in the web-client as well. I look forward to seeing more great content coming from you.
Keep it up!
Hey Brian,
Thank you for your kind comment. It’s appreciated even more coming from a VMware’s PM.
Jason
[…] When you enable HA, the FDM agent is configured on the ESXi host. A cluster contains one single master host and that master host tells the other hosts in the cluster what exactly to do when a host fails. If the master host fails, the other hosts will have an election and elect a new master. Learn more about HA setup and configuration. […]