Save to My DOJO
In a previous article, I gave you an introduction to using performance counters with Hyper-V and PowerShell. Of course you can use performance counters to manage all sorts of things, but personally, memory is the most critical. Even though I’m running Hyper-V in a non-production setting and don’t have access to massive server farms and back-end storage, the concepts that I am discussing will still apply to those instances. So even though this article is going to look specifically at Dynamic Memory counters, you might need something else. I encourage you, as with all of my content, to look at the techniques and concepts and not focus entirely on the end result.
Finding Instances
I am running Hyper-V on my Windows 10 box and will be querying the local computer. But there’s no reason this won’t work with a remote Hyper-V server. Although I have not tested anything with Window Server 2019. To keep the code re-usable I’ll define a variable for the Hyper-V host. You naturally will set it to whatever you need.
$Computer = $env:COMPUTERNAME
I want to check for counter instances on a single virtual machine. In the previous article, I talked about getting counter data from instances so I’m going to use a regular expression pattern to retrieve the instances associated with a given VM.
$VMName = "WIN10"
[regex]$rx = "(?<=\\).*(?=\)"

$c = get-counter -listset 'Hyper-V Dynamic Memory VM' -ComputerName $computer |
Select -expand PathsWithInstances | where {$_ -match $VMName}
This is what I get.

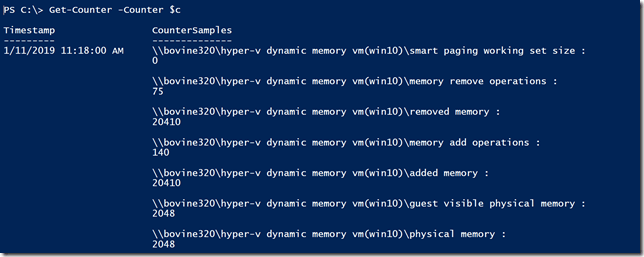
I can pass this array of counters to the Get-Counter cmdlet.

There are a few more but you get the idea.
Monitoring Performance Counters
One of the nice features in Get-Counter is that you can watch a given set of counters. I will trust that you will read full cmdlet help and examples. But I can run this command to collect 10 samples of the specified counters, taking a reading every 2 seconds.
Get-Counter -counter $c -SampleInterval 2 -MaxSamples 10
Don’t get too gung-ho on your sampling interval.
The PowerShell output is far from user-friendly. You might want to save all the output into a variable or export to an XML file. Don’t use CSV. Or, let’s have PowerShell format the results into something a bit more manageable.
Get-Counter -Counter $c |
Select-object -expandproperty Countersamples |
Sort-object -property InstanceName |
Select-object -property InstanceName,
@{Name="Counter";Expression={Split-path $_.path -Leaf}},
Cookedvalue,timestamp,
@{Name="VMHost";Expression={$rx.Match((Split-Path $_.path)).value.ToUpper()}} |
Format-Table
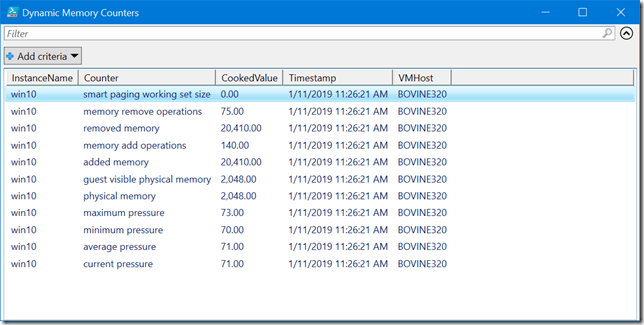
This is much easier to read.

Or send it to Out-Gridview.
Get-Counter -Counter $c |
Select-object -expandproperty Countersamples |
Sort-object -property InstanceName |
Select-object -property InstanceName,
@{Name="Counter";Expression={Split-path $_.path -Leaf}},
Cookedvalue,timestamp,
@{Name="VMHost";Expression={$rx.Match((Split-Path $_.path)).value.ToUpper()}} |
Out-GridView -Title "Dynamic Memory Counters"

Of course, none of this is actual monitoring. Here’s a code sample that achieves the same result as my earlier snippet: 10 samples at a 2-second interval.
1..10 | foreach {
    $data = Get-Counter -Counter $c | Select-object -expandproperty Countersamples |
    Sort-object -property InstanceName
    clear-Host
    $data | Select-object -property InstanceName,
    @{Name="Counter";Expression={Split-path $_.path -Leaf}},
    Cookedvalue,timestamp,
    @{Name="VMHost";Expression={$rx.Match((Split-Path $_.path)).value.ToUpper()}} |
    Format-Table
    Start-sleep -Seconds 2
}
In this example, I am using the PowerShell console window as a monitoring tool. The performance data is written to the console with a refresh every 2 seconds.
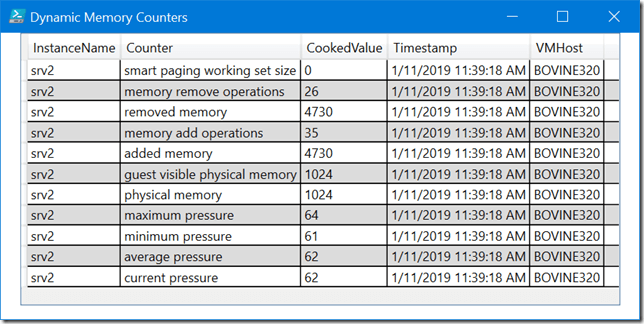
Another option is to use my ConvertTo-WPFGrid function which is part of my PSScriptTools module which you can install from the PowerShell Gallery. With this command, I can display the performance counter data in a graphical form that will automatically refresh itself. Here’s a complete code snippet.
$computer = $env:COMPUTERNAME
[regex]$rx = "(?<=\\).*(?=\)"

$VMName = "SRV2"
#get the available counters
$c = get-counter -listset 'Hyper-V Dynamic Memory VM' -ComputerName $computer |
Select -expand PathsWithInstances | where {$_ -match $VMName}

1..5 | foreach {
    Get-Counter -Counter $c | Select-object -expandproperty Countersamples |
    Sort-object -property InstanceName |
    Select-object -property InstanceName,
    @{Name="Counter";Expression={Split-path $_.path -Leaf}},
    Cookedvalue,TimeStamp,
    @{Name="VMHost";Expression={$rx.Match((Split-Path $_.path)).value.ToUpper()}} |
    ConvertTo-WPFGrid -Title "Dynamic Memory Counters" -Timeout 10 -Height 300 -Width 600 -CenterScreen
}
When run I get something like this:

My code snippet is getting 5 samples every 10 seconds. You could also use a Do Loop or other techniques to achieve the same effect.
Fine-Tuned Performance Gathering
Before I wrap up for today let me leave you with some techniques for fine-tuning the capture of performance counter data. Let’s say that I am interested in the Pressure counters for a single virtual machine. I can fine tune the regular expression pattern to retrieve just those performance counter instances.
$computer = $env:COMPUTERNAME
$VMName = "SRV2"
[regex]$rx = "(?<=\\).*($VMName)\.*Pressure"

#get the available counters
get-counter -listset 'Hyper-V Dynamic Memory VM' -ComputerName $computer |
Select -expand PathsWithInstances | where {$_ -match $rx}

Using this as the foundation and with some additional regular expression voodoo, I can build a little bit of monitoring code for a single virtual machine.
$computer = $env:COMPUTERNAME
$VMName = "SRV2"
[regex]$rx = "(?<=\\).*($VMName)\.*Pressure"
[regex]$rxCounter = "(?<=\\).*(?=\)"

#get the available counters
$c = get-counter -listset 'Hyper-V Dynamic Memory VM' -ComputerName $computer |
Select -expand PathsWithInstances | where {$_ -match $rx}

for ($i=0;$i -lt 12;$i++) {
    Get-Counter -Counter $c | Select-object -expandproperty Countersamples |
    Sort-Object -property Path |
    Select-Object -property @{Name="VMHost";Expression={$rxCounter.Match((Split-Path $_.path)).value.ToUpper()}},
    @{Name="VMName";Expression = {$_.InstanceName.toUpper()}},
    @{Name="Counter";Expression={Split-Path $_.path -Leaf}},
    Cookedvalue,TimeStamp  |
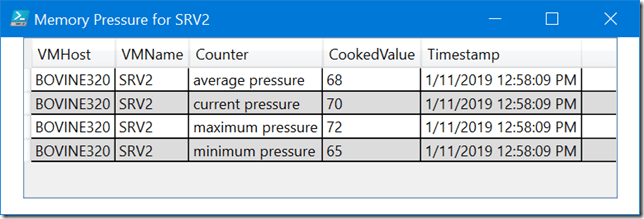
    ConvertTo-WPFGrid -Title "Memory Pressure for $VMName" -Timeout 5 -Height 180 -Width 530 -CenterScreen
}
Finding the right dimensions takes a little bit of experimentation.

Next time I’ll wrap up this series on Hyper-V performance counters in PowerShell with a technique I think you’ll find intriguing.
If you’re having problems with your PowerShell scripts use this guide to troubleshoot, diagnose problems and solve your PowerShell woes.


Not a DOJO Member yet?
Join thousands of other IT pros and receive a weekly roundup email with the latest content & updates!


