Save to My DOJO
Table of contents
In the previous part we explored techniques for getting performance counter data from your Hyper-V servers using PowerShell. Today we’ll continue poking around and look at some counters targeted more at the individual guests you may have running. Knowing what resources they are consuming can help you keep an eye on your overall server health as well as identify guests that may be running amok.
To simplify my PowerShell commands, I’m going to create a variable for the remote Hyper-V server.
$hv = "chi-hvr2.globomantics.local"
As before, the commands I’m going to demonstrate should work in PowerShell 2.0 or later. Since we are only looking at performance counters you don’t need any Hyper-V components installed locally. The first item I want to look at is dynamic memory.
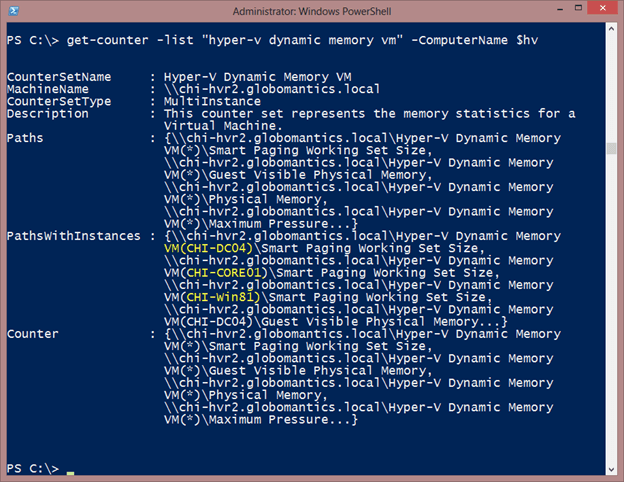
get-counter -list "hyper-v dynamic memory vm" -ComputerName $hv
You’ll notice in the figure that each of the running virtual machines has an instance.
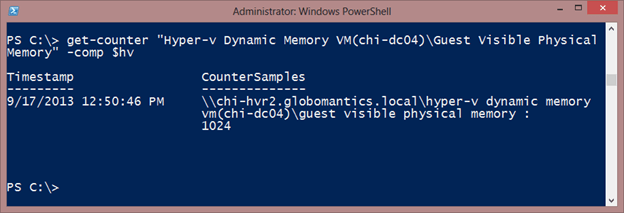
This means I can run a command like this
get-counter "Hyper-v Dynamic Memory VM(chi-dc04)Guest Visible PhysicalMemory" -computername $hv
Or like this to see all the guests.
get-counter "Hyper-v Dynamic Memory VM(*)Guest Visible Physical Memory" -comp $hv
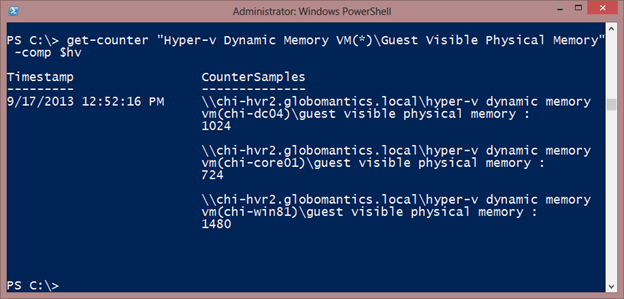
This is the same type of information you can get with the PowerShell Hyper-V cmdlets, but you don’t need them when using Get-Counter. You can also get all counters for Dynamic Memory VM either per guest or for all of them, using *.
get-counter "Hyper-v Dynamic Memory VM(chi-dc04)*" -computername $hv
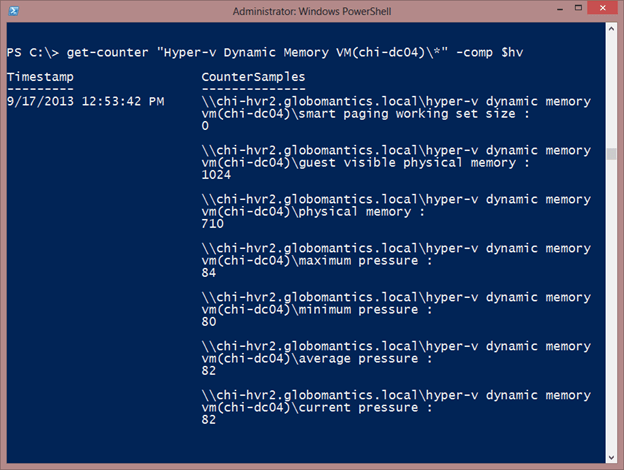
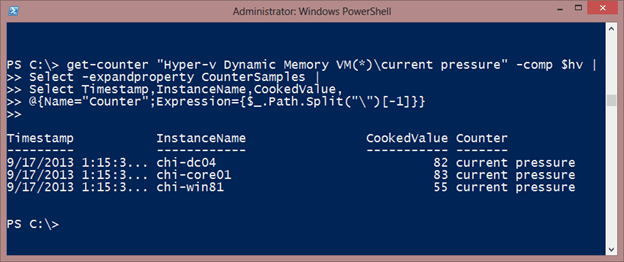
Personally, I prefer reformatting the results into something a bit easier to read.
get-counter "Hyper-v Dynamic Memory VM(*)current pressure" -computername $hv |
Select -expandproperty CounterSamples |
Select Timestamp,InstanceName,CookedValue,
@{Name="Counter";Expression={$_.Path.Split("")[-1]}}
All of the good stuff is in the CounterSamples property.
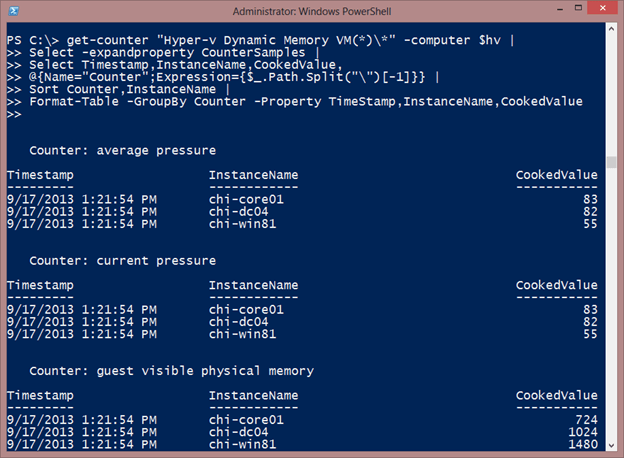
Or you might want a more formal report of memory counters.
get-counter "Hyper-v Dynamic Memory VM(*)*" -computername $hv |
Select -expandproperty CounterSamples |
Select Timestamp,InstanceName,CookedValue,
@{Name="Counter";Expression={$_.Path.Split("")[-1]}} |
Sort Counter,InstanceName |
Format-Table -GroupBy Counter -Property TimeStamp,InstanceName,CookedValue
I’m using basically the same command as before except I’m formatting all the counters into a nice looking table.
Even though I’ve been getting single counter values, it is possible to get performance data on a more regular basis using the –SampleInterval parameter. Although technically you don’t need to specify it because the default and minimal sampling interval is 1 second, I think you rarely need to sample that quickly. You can take a limited number of samples as I do here with a network adapter counter on a single virtual machine.
get-counter "Hyper-V Virtual Network Adapter(CHI-Win81*)bytes/sec" -ComputerName $hv -SampleInterval 5 -MaxSamples 12
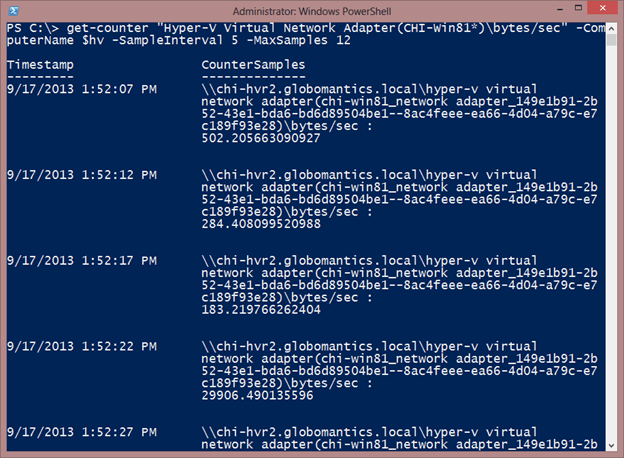
An alternative is to run the sample continuously with –Continuous. Use Ctrl-C to break. One thing to be aware of is that PowerShell begins the sampling interval immediately. For example, if your sample interval is 30 seconds, you will have to wait 30 seconds to get the first sample. I wish the cmdlet would sample immediately and then wait, but it doesn’t.
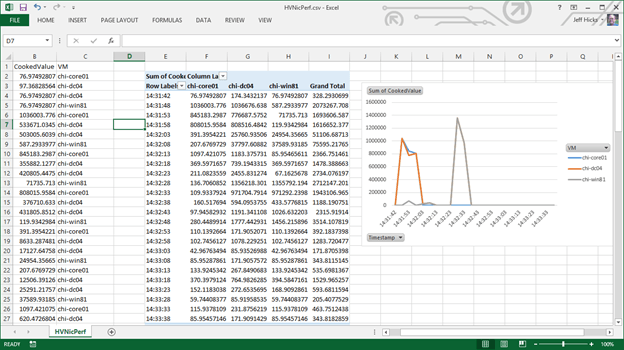
Where this might come in handy is to capture a lot of performance data, export it to a CSV file, then open it in Microsoft Excel and analyze. I would suggest gathering all of your samples in a background job.
Start-Job {
get-counter "Hyper-V Virtual Network Adapter(CHI*)bytes/sec" -ComputerName chi-hvr2.globomantics.local -SampleInterval 5 -MaxSamples 24 |
Select -expandproperty CounterSamples |
Select Timestamp,CookedValue,
@{Name="VM";Expression={ $_.instancename.split("_")[0]}},
@{Name="Counter";Expression={$_.Path.Split("")[-1]}} |
Export-Csv -Path C:WorkHVNicPerf.csv –NoTypeInformation
} -Name NicPerfData
Because of the way jobs work, you need to include the re-formatting code as part of the job. But when the job is complete, I will have a CSV file with all of the network adapter performance counter information. I can open it in Excel and analyze and chart to my heart’s content.
There are any number of counter combinations you might want to track. Admittedly, the hardest part of the process may be identifying what to measure. So let me see if I can help with a command like this:
get-counter -list hyper-v* -ComputerName $hv | select -expand pathsWithInstances | where {$_ -match "chi-dc04"}
This will find all counter instances for the virtual machine CHI-DC04.
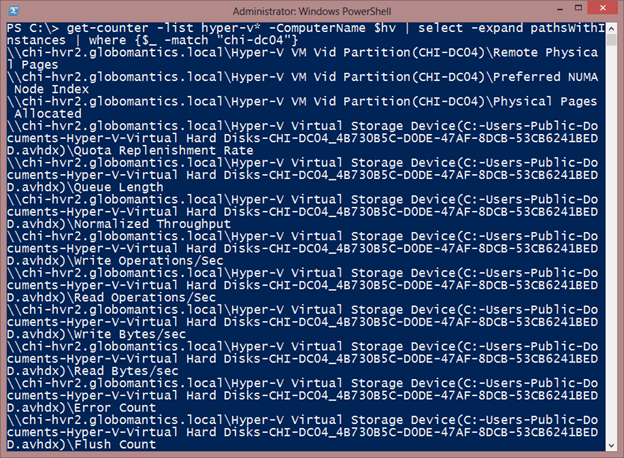
Once I know the counters, I can build a set for a single machine, or if I have a naming convention for my virtual machines, which I do, I can use a wild card. Here’s some standard performance gathering I do.
$vm="CHI-*"
$computername = "chi-hvr2.globomantics.local"
$ctrs="Hyper-V Dynamic Memory VM($vm)Physical Memory",
"Hyper-V Dynamic Memory VM($vm)Average Pressure",
"Hyper-V Dynamic Memory VM($vm)Current Pressure",
"Hyper-V Dynamic Memory VM($vm)Smart Paging Working Set Size",
"Hyper-V Virtual Network Adapter($vm*)bytes/sec",
"Hyper-V Virtual Network Adapter($vm*)packets/sec"

$data = get-counter -Counter $ctrs -ComputerName $computername -SampleInterval 10 -MaxSamples 12
Certainly the sampling interval and number can change. But once the data is complete, I can format it:
$results = $data | Select -expandproperty CounterSamples | Select Timestamp,InstanceName,CookedValue,
@{Name="Counterset";Expression={$_.Path.Split("")[4]}},
@{Name="Counter";Expression={$_.Path.Split("")[5]}}
And finally I can do whatever I want: export to a CSV, write to a database or analyze with Out-Gridview:
$results | out-gridview
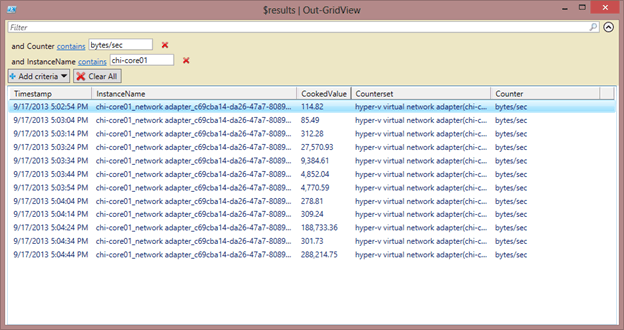
By no means do I suggest that you have to use PowerShell. You might find it just as easy to use the performance counter management console. But if you are already using PowerShell to manage your Hyper-V infrastructure, you might find this an added incentive to expand your PowerShell prowess.


Not a DOJO Member yet?
Join thousands of other IT pros and receive a weekly roundup email with the latest content & updates!


