Save to My DOJO
Table of contents
- Decide Where to Install Nagios
- Installing Ubuntu 12.04 LTS as a Hyper-V Virtual Machine
- Install Nagios
- Ease Nagios Management
- Configuring a Local E-mail Sender
- Configuring Nagios to Send Mail Through a Public SMTP Server
- Creating the Backup Nagios Server
- Basic Configuration
- Initial Monitoring Configuration and Web Interface Intro
- Handling Outages
- Monitoring Windows and Hyper-V Servers
- Remote Configuration
- What Have I Done?
System monitoring is one of the more important things we can do for our datacenters, as it helps to spot problems in the onset phase where they can be dealt with gracefully instead of waiting for an obvious failure that requires downtime. There are a huge number of monitoring tools that work with Hyper-V on the market today. One that I’m fond of is Nagios Core. It is easily one of the most powerful systems you can get your hands on, and you just can’t beat the price (free). It does come in a commercial version which adds a lot features, mostly in the user-friendliness department. Therein lies the rub with the free version: it’s not the easiest thing in the world to set up. This blog post will walk you through setting up Nagios Core and configuring basic monitoring to monitor Hyper-V.
Decide Where to Install Nagios
Preferably, you’ll have at least two Nagios systems; one to monitor your systems and one to monitor the other Nagios server. Personally, I prefer to have Nagios run inside a virtual machine for a variety of reasons. Since my test lab has three physical systems, two running Hyper-V Server and one running Windows Server, I can have two virtualized Nagios installations. If you’ve only got one system running Hyper-V, I would recommend that you use one virtual installation and one physical installation.
Nagios Core has been forked into a Windows version. I have no idea how up-to-date it is in comparison to the main branch and I don’t recommend that it be used. Nagios should be the only thing on its system and there’s really no call to soak up a Windows license for what it does. Instead, I recommend using a Linux distribution. The instructions in this post will cover doing so and will make it easy even for non-Linux people to do. If you’re going to be using a Linux distribution, feel free to use any hardware you’ve got available, even an old desktop that was planned for the recyclers. Hardware requirements are minimal, depending on the distribution that you choose. This post will illustrate Ubuntu 12.04 LTS, whose hardware requirements are very slim.
Installing Ubuntu 12.04 LTS as a Hyper-V Virtual Machine
If you have Linux knowledge and prefer to use another distribution, go ahead and get it set up and skip down to the Nagios setup directions later in this article.
I have chosen the desktop version of Canonical’s Ubuntu 12.04 LTS (long-term support) for my Nagios system. There are two newer versions, 12.10 and 13.04. 13.04 runs perfectly miserably as a Hyper-V Server 2012 guest. The video performance is unbearable and the tweaks I’ve found haven’t helped enough in my opinion. Also, power commands don’t work correctly; shut down and restart both leave it at a black screen and you need to force it off. 12.10 might be workable, but 12.04 will have support from Canonical until 2017 (that’s what LTS means), so you can count on regular security updates, etc. Ubuntu is based on Debian, and Debian is not on the official supported distribution list for Hyper-V, so I suppose there’s a bit of caveat emptor here. However, I doubt Microsoft would be jumping through any hoops to support a CentOS guest running Nagios either, so I don’t think this is a major concern.
I chose to use the desktop distribution rather than the server distribution because it comes with a GUI. My Linuxese isn’t bad for a Windows admin, but I really don’t have the time to go for expert level. I’m assuming that anyone interested in this article has the same limitation. If you want to use a GUI-less installation, go for it. I don’t know how to help you, though.
- Begin by downloading the Ubuntu 12.04 LTS ISO. Use 32-bit, not 64-bit. You won’t be doing anything that comes anywhere near needing 64-bit and I had lots of trouble with the 64-bit distribution in Hyper-V Server 2008 R2. Also, some of the support packages for Nagios didn’t install correctly in 64-bit.
- While the bits are downloading, create a virtual machine to run it. I typically use a single vCPU, 512MB vRAM, and a 30GB dynamically expanding VHD (it will get up to around 8GB).
- Connect it to a virtual network, preferably one that can contact the Internet, but definitely to one that can reach your other systems.
- Attach the ISO image and boot it up. It will go straight into the installation process. The Ubuntu desktop installation is extremely straightforward. Just walk through and answer the questions as you see fit. The only place where you might have a question is when it asks if you want to install some components for video and audio decoding. I would advise against it since that’s not what this system is for, but it’s up to you.
- At the very end, it will ask that you reboot. I can say with almost absolute certainty that it will freeze up. Use the Hyper-V tools to force it to power off and then turn it back on and everything will proceed.
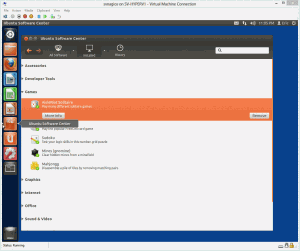
Once the installation has completed, you can perform some customizations. I typically set the background to a solid color (just right-click on the desktop and you’ll find what you’re looking for). I also use the Software Center (its icon looks like an orange shopping bag on the Launcher bar at the left side of the screen) to remove software that I don’t need. I don’t recommend going crazy with this, as it’s not going to change much. To find the icon, look at the screenshot below for reference:
This screenshot will be referred to again throughout this post, so let’s take a break and get some anatomy lessons:
- “Unity” is the name of the interface in Ubuntu.
- The bar of icons at the left is the Launcher bar. It works much like the taskbar (Start bar) in Windows.
- The button at the top of the Launcher with the Ubuntu icon is the “Dash Home” button, and it works sort of like the Start menu/screen in Windows.
- The button directly below that shows up as “Home Folder” when you hover over it and it is Ubuntu’s file manager.
- The bar across the top is similar to the notification area of the taskbar in Windows with one major exception: when any window is maximized, its title bar is merged with this bar.
Notice that in any window, the close, minimize, and maximize buttons are at the left like an Apple OS instead of on the right like a Windows OS. Otherwise, windows work pretty much the same way. One thing that Ubuntu ships natively is the “Workspaces” concept in which you are look at one of four virtual screens. You can navigate between these using the button at the bottom of the Launcher bar. There are keyboard shortcuts too. I don’t know what they are, but sometimes I trigger them by accident and wonder where all my windows went. Check your workspace if this happens to you. Power controls, log off, software updates, and other system functions are found by clicking the gear icon at the top right of the screen.
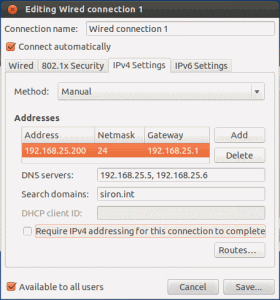
You can set a static IP for your Ubuntu system by clicking on the up and down arrows icon at the top right. Click “Edit Connections”. This will show the “Network Connections” dialog and have “Wired Connection 1” highlighted. If not, make sure it’s on the “Wired” tab and select that item, then click “Edit”. You can rename the connection if you want. Switch to the “IPv4” tab. Below is a sample:
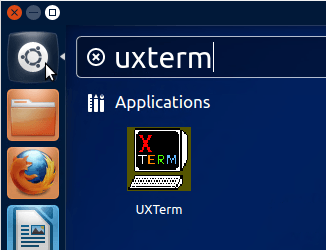
Ubuntu will not self-register in DNS, and since you’ve statically assigned it, Windows DHCP can no longer do it for you. It’s up to you if you want to add an A record for it. Optionally, you can set up a reservation and configure DHCP to handle DNS registration for it. The last part of Ubuntu installation is updates. You’ll probably have a bouncing, flashing icon on the Unity bar encouraging you to update. It may install them for you and turn the configuration gear icon red to let you know you need to reboot. You may need to access the system menu and manually tell it to install updates. However you do it, make sure Ubuntu is patched before proceeding. Even when it says it’s up-to-date, click into the Software Updater anyway and click the “Check” button until there are no further updates. The last thing to do is get easy access to a terminal window (this is like the command-line in Windows). Click the “Dash Home” button which is at the top left of the screen and looks like the Ubuntu icon. Type “uxterm”. It will automatically search for and locate the UX Terminal program. Click and drag its icon to the Launcher:
More on using Ubuntu on Hyper-V here: Getting Started with Ubuntu Linux Server as a Hyper-V Guest.
Install Nagios
You’ll need to setup a few things in Linux before you can start setting up Nagios. Click the UXTERM icon you placed on your Unity bar. Always remember that the console in Linux is case-sensitive. In the console, type sudo -s and press Enter. You’ll need to provide your password. Doing this grants you super-user (administrator) powers in this console window until you close it. The following directions were lifted almost verbatim from the Nagios community site. I’ve added a couple of tweaks, such as the previously indicated “sudo -s” that will prevent you from needing to sudo all your commands (normally, you have to prepend “sudo” to many things you do in Linux and then provide a password… good security, but gets annoying fast for something like this). First, install the prerequisites:
apt-get install apache2 build-essential libapache2-mod-php5 libgd2-xpm-dev libssl-dev php5-gd
Watch it for confirmations and errors. Usually, an error means a typo. Just re-enter the same command if you’re not sure which packages didn’t install. Add a user account for managing Nagios and give it a password:
useradd -m -s /bin/bash nagios
passwd nagios
Create a security group for users that can manage Nagios. Add users to it:
groupadd nagcmd
usermod -a -G nagcmd nagios
usermod -a -G nagcmd www-data
Now, acquire Nagios. From inside your Linux installation using the Firefox icon from the Unity bar, download it directly from their site (http://www.nagios.org). Download both Nagios Core and Nagios Plugins. This blog post covers Nagios 3.5.0 and Nagios plugins 1.4.16. Notice that you can purchase editions with more features. This post covers only the DIY version, but if you can afford it, a financial contribution to the Nagios is good for us all. Note that if you purchase a Student edition or higher in hopes of using the pre-built VM to get out of the rest of this post, you’re going to get VMs designed to run on CentOS’s virtualization platform. While I have nothing against that platform (since I’m aware of nothing beyond its existence), it’s not going to do you a lot of good if your hypervisor is Hyper-V.
Once you’ve downloaded the packages, you can click them from within the Firefox download manager and this will automatically start the archive manager tool. Click the Extract button in the toolbar. You can place the extracted files anywhere you like, but the following instructions will assume you just clicked the Extract button in the lower left which places them in your Downloads directory. Once the files are extracted, close the archive manager. Go back to your UXTERM prompt. Assuming you placed the download files in the default location, you can use all the following commands to install Nagios and extract its initial configuration files:
cd ~/Downloads/nagios
./configure --with-command-group=nagcmd
make all
make install
make install-init
make install-config
make install-commandmode
The above will take some time, especially the first “make install”. Don’t worry about all the warnings. At this point, you have enough for monitoring and notifications. However, there’s also a web component that’s very useful. It gives you a dashboard-style view into your environment. To set that up:
make install-webconf
htpasswd -c /usr/local/nagios/etc/htpasswd.users nagiosadmin
/etc/init.d/apache2 reload
The above creates a web-only user named “nagiosadmin” with the password that you specify. It is applicable only when logging on to the local Nagios website.
Finally, install the plugins and configure security for them (tab completion is very helpful on the first line):
cd ~/Downloads/nagios-plugins-1.4.16
./configure --with-nagios-user=nagios --with-nagios-group=nagios
make
make install
The last installation step is ensure that Nagios starts when Ubuntu is booted:
ln -s /etc/init.d/nagios /etc/rcS.d/S99nagios
This concludes the installation of Nagios.
Ease Nagios Management
Next, we’ll take a few moments to make some changes that will make working with your Nagios installation much easier. First, add your own user account to all the previously created security groups so that you don’t have to log in as those users to make changes. You’ll also want to do this for other admins. You’ll also need to create an account for yourself in the Apache security settings:
usermod -a -G nagcmd eric
usermod -a -G nagios eric
htpasswd /usr/local/nagios/etc/htpasswd.users eric
/etc/init.d/apache2 reload
The last two lines above create an account for Apache. I’ve used the same name as my Linux account, but be aware that these are separate accounts and their passwords can be different. Note that unlike the first time you used this command, this one does not use the -c switch. If you use that, the file is emptied and recreated with only the account specified — very bad.
Next, we’re going to create some shortcuts to the desktop so you don’t have to memorize control commands. Note: Creating an executable script on the desktop is more complicated in Ubuntu versions after 12, so you’ll need to do some research if you went with a later version. Right-click anywhere on the desktop and click New Document, then Empty Document. The document will be created and allow you to assign a name. Call it “Restart Nagios.sh”. Create three more documents: “Stop Nagios.sh”, “Start Nagios.sh”, and “Validate Nagios.sh”. In turn, open each one (just double-click), and set their contents as follows:
sudo /etc/init.d/nagios restart
echo "Verify the output, then press Enter to continue."
dd bs=1 count=1 >/dev/null 2>&1
sudo /etc/init.d/nagios stop
echo "Verify the output, then press Enter to continue."
dd bs=1 count=1 >/dev/null 2>&1
sudo /etc/init.d/nagios start
echo "Verify the output, then press Enter to continue."
dd bs=1 count=1 >/dev/null 2>&1
sudo /usr/local/nagios/bin/nagios -v /usr/local/nagios/etc/nagios.cfg
echo "Verify the output, then press Enter to continue."
dd bs=1 count=1 >/dev/null 2>&1
Once they’re created, select all of them by dragging a box around them. Then right-click on any of them and choose Properties. Switch to the Permissions tab. Next to “Execute”, click “Allow executing file as program” until it has a checkbox (needs two clicks from an empty checkbox). Once these files are marked as executable, double-clicking on them will generate a prompt asking how you want to handle them. Choose “Run in Terminal” if you want to perform the script. As mentioned earlier, this doesn’t work in Ubuntu 13.x.
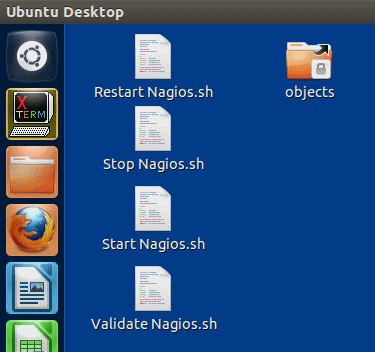
Now, click on the “Home Folder” button on the Launcher bar. Click “File System” on the left of this window. Double-click folders in turn until you’ve drilled down to /usr/local/nagios/etc. Hold down SHIFT and CTRL while clicking on the “objects” folder and drag it to the desktop. This should create a shortcut; you’ll know because it has a small arrow and (possibly) a lock on it. Your desktop should now look like the following:
You’ll use the “objects” folder to modify what you’re monitoring and how Nagios reacts. These are text files, and it’s easy to make errors in them, especially when you’re not familiar with Nagios. Before making any changes, it’s recommended that you make copies of them. After making changes, you have to restart Nagios to have them go into effect. However, prior to doing that, you can validate the configuration files by running the Validate Nagios shortcut you created. It will locate errors in the configuration files so you can correct them without restarting the service. Nagios will not start at all if the configuration files are not completely valid.
One thing I really like to do is change the URL. By default, you have to view the Nagios web interface through http://192.168.25.200/nagios, obviously using whatever IP you set. If you created an A record, you can use that instead: http://svnagios/nagios. Still, that’s a bit much. What I want is http://nagios and http://nagiosbackup. In fact, I want to expose my primary Nagios system to the Internet and use port forwarding to ship port 80 traffic to my Nagios box and then create an A record in my public domain that points http://nagios.mybusiness.com right to that server. Sound good to you? No problem. First, create the necessary A records. Internally, I have an A record for “nagios” that goes to 192.168.25.200 and one for “svnagiosbackup” that goes to http://192.168.25.201. The external record is trickier so if you’re interested in that, I’ll leave it up to you, your domain host, and your firewall to sort out. Once the A records are created, open up a terminal prompt and run the following:
sudo -s
gedit /etc/apache2/conf.d/nagios.conf
In the window that opens, either remove what’s there or comment it out (prepend a # to each line). I recommend commenting so you can refer to it later, but whatever you think is right. At the end of the file, insert the following, substituting in your server names:
<VirtualHost *:80>
	ServerName	nagiosbackup.siron.int
	ServerAlias	nagiosbackup.siron.int
	DocumentRoot	/usr/local/nagios/share
	ScriptAlias	/nagios/cgi-bin "/usr/local/nagios/sbin"
	ScriptAlias	/cgi-bin	"/usr/local/nagios/sbin"
	Alias		/nagios		/usr/local/nagios/share
	<Directory "/usr/local/nagios/sbin">
		Options ExecCGI
		AllowOverride None
		Order allow,deny
		Allow from all
		AuthName "Nagios Access"
		AuthType Basic
		AuthUserFile /usr/local/nagios/etc/htpasswd.users
		Require valid-user
	</Directory>

	<Directory "/usr/local/nagios/share">
		Options None
		AllowOverride None
		Order allow,deny
		Allow from all
		AuthName "Nagios Access"
		AuthType Basic
		AuthUserFile /usr/local/nagios/etc/htpasswd.users
		Require valid-user
	</Directory>
</VirtualHost>
You can use a different alias as well. I’m not really exposing my home lab to the Internet so I don’t need to get fancier than this. Now, your Nagios box will respond on the previous URLs (http://192.168.25.200/nagios”) and any that come in to the root (http://nagiosbackup) as well.
Once you’ve made the changes, restart Apache: /etc/init.d/apache2 restart . Watch it for errors.
Configuring a Local E-mail Sender
The best way to have Nagios notify you is through e-mail. Of course, you might have it monitor your mail server, so it will be fairly useless if you use that mail server to send notifications and it goes offline. Instead, configure your Nagios server to handle its own mail. You can do this with the Postfix application, which will turn your Nagios system into a sending mail server. In order for this to work, you’re going to need to convince the world that you’re not a spammer. My test lab is at my home which is on consumer-grade DSL which is using DHCP which means the world thinks I’m a spammer. You’re going to need a static IP address as a source and your ISP is probably going to need to create a reverse DNS record for that IP (it doesn’t matter what the name is). If you’re already hosting a mail server, this is probably already done so you can just set up the Postfix as follows. If not, skip down to the section about sending through a public ISP.
If you don’t have your terminal window open anymore, click your UXTERM icon and run sudo -s . Then, run the following:
apt-get install mailutils
apt-get install postfix
This will automatically launch the Postfix configuration process. On the first screen, press TAB so that the <OK> line is highlighted and press ENTER. Just hit ENTER all the way through the rest of the screens, because this doesn’t allow you to configure it all the way. Once it’s finished, run:
sudo dpkg-reconfigure postfix
This will start the configuration tool which will start out as earlier, but will have all the necessary screens. On the second screen, press ENTER with “Internet Site” highlighted. The third screen is essentially the mail domain that you want your Nagios messages to come from. You won’t be configuring this system to receive mail (unless you decide you like Postfix and want to use it for that purpose). You’ll probably want to use your actual mail domain to keep your system from flagging the messages as spam. This server will not receive mail, so you can skip the postmaster screen and the incoming domains screen. Select <No> on the force synchronized update screen, it’s safe since you’re using a journaling file system and this isn’t a critical mail server. Also accept the defaults for local networks; putting any other networks on here will allow this system to relay mail for other computers and that could be a very bad thing. You can accept the default on the mailbox size limit; again, this server won’t receive mail so it doesn’t matter. Hit ENTER on the local address extension screen. On the IPv4/IPv6 screen, choose as appropriate for this system. To test, run the following inside your terminal window, substituting values for your own domains as necessary:
telnet 127.0.0.1 smtp
helo nagiostestmail.mydomain.com
mail from:[email protected]
rcpt to:[email protected]
data
subject:Checking Nagios e-mail
Hi, this is a test message from the Nagios system.
.
quit
Each line you enter will be received with a numeric and text response. All response codes should be 250 except the initial connect and quit command. Your message will be sent immediately and, depending on the server you sent it to, should arrive soon thereafter. Don’t forget to watch your spam folder as well! Follow the same test from a remote computer, modifying the telnet command so that it connects to the Nagios server’s actual IP. This should work all the way through RCPT TO, which should return “554 5.7.1 <[email protected]> Relay access denied”. This is intentional, because we only configured it to relay for the loopback subnet (127.0.0.1).
If your message isn’t going through, use the file manager to navigate to /var/log and double-click the mail.log file. You’ll find out what’s going on here. If your IP is on a spam list, the log should say so.
Configuring Nagios to Send Mail Through a Public SMTP Server
Only do this if you can’t use the Postfix directions above for some reason. I have stolen 90% of the directions that follow from Daniel’s Blog with a little update from Daniel That.
Start off by configuring the outgoing mail log file and installing the necessary modules:
touch /var/log/sendEmail.log
chmod 666 /var/log/sendEmail.log
apt-get install libio-socket-ssl-perl libnet-ssleay-perl perl sendemail
Use the file manager (click on the “Home Folder” button on the Launcher) and navigate to /usr/local/nagios/etc. Double-click on the resource.cfg file and append the following, substituting in the values for your ISP’s e-mail system:
[email protected]
$USER7$=smtp.server.tld
$USER9$=authsmtpusername
$USER10$=authsmtpassword
The second two are only necessary if your SMTP server requires authentication. Almost all ISP mail servers do these days, although some just restrict by source IP address. You’ll need to check with your provider for the values to use or just search the Internet for POP/SMTP settings for your provider. For instance, since I use an @live.com account, I found these directions, which would also work for @hotmail.com and @outlook.com accounts.
Now, go into the “Objects” folder. If you’ve still got the file manager window open, you’re one level above it. If you closed it, use the desktop shortcut you created. Double-click the commands.cfg file. In the “notify-host-by-email” definition, replace the command_line item (or # it out and make a new one) with the following:
/usr/bin/printf "%b" "***** Nagios *****nnNotification Type: $NOTIFICATIONTYPE$nHost: $HOSTNAME$nState: $HOSTSTATE$nAddress: $HOSTADDRESS$nInfo: $HOSTOUTPUT$nnDate/Time: $LONGDATETIME$n" | /usr/local/bin/sendEmail -s $USER7$ -xu $USER9$ -xp $USER10$ -t $CONTACTEMAIL$ -f $USER5$ -l /var/log/sendEmail.log -u "** $NOTIFICATIONTYPE$ Host Alert: $HOSTNAME$ is $HOSTSTATE$ **" -m "***** Nagios *****nnNotification Type: $NOTIFICATIONTYPE$nHost: $HOSTNAME$nState: $HOSTSTATE$nAddress: $HOSTADDRESS$nInfo: $HOSTOUTPUT$nnDate/Time: $LONGDATETIME$n"
In the “notify-service-by-email” definition, replace its command_line with:
/usr/bin/printf "%b" "***** Nagios *****nnNotification Type: $NOTIFICATIONTYPE$nnService: $SERVICEDESC$nHost: $HOSTALIAS$nAddress: $HOSTADDRESS$nState: $SERVICESTATE$nnDate/Time: $LONGDATETIME$nnAdditional Info:nn$SERVICEOUTPUT$" | /usr/local/bin/sendEmail -s $USER7$ -xu $USER9$ -xp $USER10$ -t $CONTACTEMAIL$ -f $USER5$ -l /var/log/sendEmail.log -u "** $NOTIFICATIONTYPE$ Service Alert: $HOSTALIAS$/$SERVICEDESC$ is $SERVICESTATE$ **" -m "***** Nagios *****nnNotification Type: $NOTIFICATIONTYPE$nnService: $SERVICEDESC$nHost: $HOSTALIAS$nAddress: $HOSTADDRESS$nState: $SERVICESTATE$nnDate/Time: $LONGDATETIME$nnAdditional Info:nn$SERVICEOUTPUT$"
If your ISP’s SMTP server requires TLS (mine does), then append -o tls=yes to each of the above commands.
This command will log to /var/log/sendEmail.log.
Creating the Backup Nagios Server
Note: read this section before proceeding, but before actually taking these steps, you might want to read ahead and configure your contacts to save yourself a bit of duplicated work later.
If you installed Ubuntu and Nagios inside a virtual machine and have another Hyper-V Server to host the backup installation, this is the point at which you’ll want to clone the original. There are a number of ways to do this. If you’ve got SCVMM, it can make clones. If you’ve got Altaro Hyper-V Backup, you can back it up and restore it as a clone. You can also use the built-in export and import functions. My preferred method is to create a new VM with the same settings and copy the VHD file of the original. Whatever method you choose, remember not to connect it to the network for initial power-up as it will cause a name collision.
To rename the computer, open up UXTERM and run the following:
gksudo gedit /etc/hostname /etc/hosts
This will open three files: the two named above and an empty document. In both of the named files, give your computer a new name (I just use “svnagiosbackup”). Close them all and reboot the system. You can then connect it to the network and give it its IP.
If you can’t or don’t want to use a clone, just use the above instructions to install Ubuntu and Nagios on another piece of hardware.
Basic Configuration
Using the “objects” shortcut you created on the desktop, open the folder containing the Nagios configuration files (at /usr/local/nagios/etc/objects if you didn’t make the shortcut). If you did not add your user account to the nagios user group as indicated near the top of these directions, you will not be able to edit these files. Use the usermod directions above or log off and back on with the “nagios” account you created. All default items you can configure in Nagios are based on a template in the “template.cfg” file. It is recommended that you at least skim through this to get an idea for what you can do. The file names used here are just suggestions; Nagios doesn’t care what you call them. If you’ve got a small installation, you can put everything in a single file if it’s easier for you. You can remove or create your own .cfg files in this location. Nagios maintains a list of which files it will store monitoring data from in its nagios.cfg file. This file is located one level above the “objects” folder, and your desktop shortcut won’t get you to it. You’ll need to use the file manager and navigate to usr/local/nagios/etc to find it. You’re looking for the “OBJECT CONFIGURATION FILES” section, which is near the top. You can add and remove “cfg_file” entries as desired, or you can comment those out with the # character and use the “cfg_dir” directives instead, which will cause Nagios to use all files in a given directory.
Remember that for any change to take place, you have to restart the Nagios service. You are always highly encouraged to use the validation script first.
Configure Contacts
Start your configuration with the contacts.cfg file. This defines who will be contacted, when they can be contacted, and how they will be contacted. You are welcome to simply change the defaults to fit your name, but such a simple approach can really lock you out of a lot of the power of Nagios. Use groups, and use them well. Create an “On Call” group which you can rotate users in and out of. Create a “Daytime Admins” which everyone in that shift can be a member of. Use the options you can find (and add to) in the “timeperiods.cfg” file to set these up. If you’d like, you can even set up automatic rotations. One thing I like to do is create two users for each admin. Have one send e-mail to the standard work address. Have the other send an e-mail to the user’s cell phone text e-mail alias. If admins have text-capable cell phones but not smartphones, this helps them to receive messages even when they’re not near a computer. For admins with smartphones, they can configure distinctive handlers for these. Then, you can have a failure condition send an e-mail after, say, 5 minutes of outage, then a text message if the outage reaches 15 minutes. Such setups help prevent the system from waking up on-call staff for a transient problem while still sending them a notification. It also helps you notify the same person in different ways depending on, say time of day. Note: if your cell carrier doesn’t have e-mail aliases for texting, you can also use an SMS gateway.
Initial Monitoring Configuration and Web Interface Intro
Now you’re ready to start setting up monitoring. Let’s start by having your backup Nagios server monitor your primary Nagios server. Interestingly enough, there isn’t a file made just for Linux servers. However, there is a “localhost.cfg” file which currently holds a definition for the Nagios server itself and a template for a Linux system. Since the only Linux systems I have are my Nagios units, I put the other Nagios system in there as well. Hopefully this alone demonstrates how the names of the configuration files don’t really mean anything. Use the shortcut to the Objects folder that you created on your desktop and double-click the “localhost.cfg” file. Check the title bar first; if it says “read-only”, make sure that you added your current user account to the “nagios” group using the “usermod” command shown above. Log off and back on and try again. Once you can edit the file, add the following in the HOST DEFINITION section (feel free to copy, paste, and edit the existing “localhost” definition):
define host {
   use linux-server
   host_name svnagios
   alias svnagios
   address 192.168.25.200
}
These fields work a little differently than you might expect. “host_name” is a free-text field. Whatever you type here is how it will look in the web interface and be reported to you in messages. You also have to use it every time you refer to it in other locations. It’s perfectly fine to use spaces. The “address” is what matters. I used an IP address, but you can also use DNS names. Be careful with this, as that will require a functioning DNS system and you want your Nagios boxes to have minimal reliance on outside systems. Of course, if you’re really enterprising, you can install the DNS role on it and have it act as a BIND secondary for your Windows DNS systems and then it will be able to use itself for DNS resolution even when the primary DNS servers are down.
Save the file. On your desktop, double-click the “Validate Nagios” script file you created and choose “Run in Terminal”. After providing your password, you should see some text flying by. You are mostly concerned with the second-to-last line. It should say “Things look okay – No serious problems were detected during the pre-flight check”. If it says anything else, note the messages and go back and correct them (note that on the Preferences window under the Edit menu in GEDIT, you can turn off Word Wrap and turn on Line Numbers to aid you in finding problems). Once you’ve got it to a happy state, use the “Restart Nagios” shortcut.
To verify your work, open up Firefox on the system you’re using and navigate to http://localhost/nagios. First, log in with your own user account that you added to the htpasswd.users file. Then, click the “Hosts” link in the left menu. If you didn’t insert your account into the “admins” group in the contacts.cfg file, you’ll receive a message that you’re not authorized to view these hosts. By default, a web user can only view the hosts that he or she is in the contacts group for. Close and re-open Firefox and navigate back to the same site. This time, log in with the nagiosadmin account you created. Now on the Hosts tab, you’ll see your local system and the primary system, both hopefully up. Spend a little time going through the other items, such as Services and Host Groups. Notice that the SSH service shows “connection refused” (because we haven’t turned on the SSH server). Also check out the Process Info and other items under the System group in the lower left. Log off and back on as your user account and note the differences. This is what a standard Nagios user account is going to look like. This lets you have system owners who can monitor their own systems but not muck up your Nagios installation.
If you want your user account to have the same powers as nagios admin, use the file manager to navigate to /usr/local/nagios/etc. Open up the cgi.cfg file. Somewhere around line 110, you’re going to find a bunch of different entries that start with “authorized_for_”. At the end of each, just add a comma and the account name(s) you added to htpasswd.users. If you want some granularity of control, read the comments to determine what powers the individual commands grant. Restart Apache2, then log in again and see the changes.
Now you might have noticed when you verified your Nagios configuration that it gave a warning. If you investigated that, you’d have found out that the Nagios server you added has no services to check. That means that it’s not really doing anything. As you looked through the Nagios web interface, you might have also noticed that it wasn’t a part of the linux-servers group. Go back into the localhost.cfg file and scroll down to the HOST GROUP DEFINITION section. Add a comma and the host_name that you used for your primary Nagios server to the “members” line. This will ensure it shows up in the “linux-server” group.
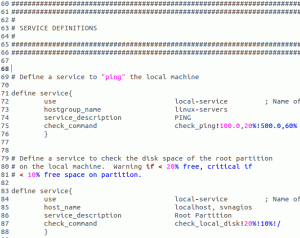
For the services to be monitored, navigate down to the SERVICES DEFINITIONS section. You have two ways to handle this. The easiest way is to just add a comma and the name of the new system to the “host_name” line. What I prefer to do is remove that line altogether and put in a “hostgroup_name” line that contains the group name(s) from the HOST GROUP DEFINITION section. This makes it easier to add and remove hosts without needing to modify every single service. Since there are only two hosts in the linux-servers group, it’s sort of a wash in this particular instance. If you have a more complicated setup, you can use both the “host_name” and “hostgroup_name” lines as needed.
You’ll also notice toward the end that the last two services, SSH and HTTP, have notifications disabled. This is why these services have that strange looking icon in the web interface; Nagios knows they’re down but won’t bother you about them. You can enable the HTTP check, since Nagios is here and should be running. You’ll decide later if you want to enable SSH. Set everything up here the way that you like, then verify and restart Nagios.
Handling Outages
Shut down your primary Nagios server and wait a few minutes. The web interface should show it as down. If you successfully configured e-mail notification, you’ll receive that within a few minutes. The web service is the interesting portion, though. Access the “Hosts” link. Once a test is issued that notices that it’s down, its entry will turn red. Click on its name to go to the detail screen for that host. Look at the entries on the left to see how Nagios is marking its status. Once your Nagios system goes into production, your primary goal is probably going to be to get it to stop bothering you about systems that you know are down. There are a few ways to get it to do that. The first, and preferred method, is to click the “Acknowledge this host problem” link on the right. You’ll need to enter a comment (preferably, something that indicates that you’re working on the issue) and then Submit it. This will send out a notification to everyone on that system’s notification list that you’ve acknowledged the problem. Notifications will then cease until Nagios detects that the system is back up. It will then send a Recovery message to the contacts for that host and its notification settings will be reset to normal.
The problem with the “Acknowledge” method is that in some networks, a ping command might return a false positive. If Nagios gets that ping response, the Recovery message is sent and the notifications are reset. If the monitored system is still actually down, the Down message goes right back out at the next check interval. So, what will happen is, you’ll get up at 2:12 AM and acknowledge a non-critical system with an “I’ll fix it in the morning” message. At 3:25, you get woken up again with notifications that the same system recovered and then went down again. In order to really shut off notifications, use the “Disable notifications for this host” link. Unlike Acknowledge, this one does not reset unless someone resets it, so only use this if the false positives actually happen to you.
Monitoring Windows and Hyper-V Servers
Now your crash course on Nagios is over and it’s time to move on to what you really come here for: monitoring your Hyper-V and Windows units. Start by getting into the templates.cfg file and really going over these items. All of your other systems are going to inherit from these, so you want to understand what they’re going to do. You can duplicate templates, or you can override line items in inheriting objects that you create.
You should be able to follow the same basic steps as you did for the Linux system to configure your Windows systems (windows.cfg). What I normally do is comment out the default “winserver” host and make new ones. Then I add them to the default windows-servers group. Next, I go through all of the services and replace the “host_name winserver” line with “hostgroup_name windows-servers”. Once that’s done, you’ll need to use the file manager to navigate to /usr/local/nagios/etc. Open up the nagios.cfg file and uncomment the line that loads windows.cfg. Verify and restart Nagios. Now when you navigate to the web page and click on Host Groups, you should see something like this:
It’s up, but all those services are reporting problems. That’s because you need to install a tiny little client inside Windows systems in order for it to monitor them. Alternately, you can kill all these service checks and write WMI checks. We’ll cover the basics of that in a future post. In the meantime, I’m going to show you how to install the client so the services can be read. Before you start, you might want to go into the host you created and click “Disable notifications for all services on this host”, or you’re going to start getting a lot of notifications.
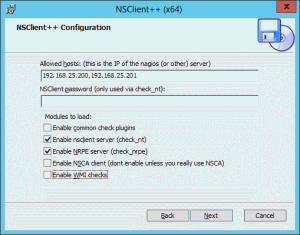
First, on the system to be monitored, open the firewall for TCP port 5666 and 12489. Then, download and install NSClient++. Follow the defaults most of the way through. The only screen of any importance is the following:
It’s up to you if you want to enable WMI checks here. Nagios, with another plugin, can send WMI commands directly in without using NSClient++. Once the installation is complete, restart the Nagios service. Most of the service checks for this system should gradually go green. For the others, well, that’s where the fun begins. What you’ll want to do is start creating new groups and moving hosts out of the generic windows-server group and into their own specialized groups. Create service checks that apply to them (copy/paste/modify from existing services is the preferred method).
Remote Configuration
Are you tired of working on your Nagios installation in that little console window? You can certainly set it up for remote configuration. What you’re going to need to do is enable its FTP and SSH services. We’ll start with FTP. Open the terminal and enter the following:
sudo -s
apt-get install vsftpd
gedit /etc/vsftpd.conf
Find the line that reads #local-enable=yes , and remove the #. Do the same for the line that reads #write-enable=yes. If you want, you can modify things like the banner, etc., but nothing else is absolutely required. Save and close the file. Back at the terminal prompt, run the following:
/etc/init.d/vsftpd restart
Now you can use an FTP client to transfer files in and out of the system. If you’re connecting with your admin account, you just navigate the directory structure as you would locally. For instance, you direct your FTP client to open /usr/local/nagios/etc/objects/windows.cfg. I use a text editor that can save and open to/from FTP locations, so I can directly work on the files. The name of this application is UEStudio. It’s nice, but it isn’t free. The benefit of having FTP access is the ability to very easily make backups of these critical files off the system. It doesn’t take long to have a very complicated Nagios setup that you just absolutely don’t ever want to have to replicate, but backing up the entire VM might be a bit much for just a few KB of text files. It’s up to you.
You can also issue the verify and restart commands remotely. You may have noticed that the web interface has a command to restart Nagios (it’s on the Process Info tab if you didn’t), but this does not validate the text files. Do not get lazy and restart your Nagios system without validating it first! Instead, enable SSH and use Putty. First, download and install Putty. While that’s installing, access the terminal on your Ubuntu system and run the following:
sudo -s
apt-get install openssh-server
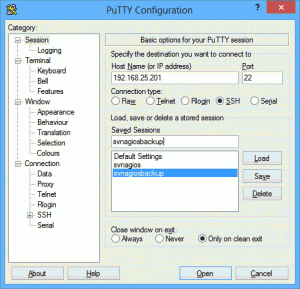
Open Putty. In the “Host Name or IP Address” field, enter the DNS name or IP of the server to be monitored. In the “Saved Sessions” field, type the name of the system or anything you can recognize later. Click “Save”:
Now click “Open”. You will get a Putty security alert because it’s receiving a secure key it’s never seen before. Click “Yes” and the key will be saved. You’ll then be asked to log in, which will leave you at the same terminal prompt you get when you use the UXTerm shortcut I had you create on the Launcher bar. Assuming you’ve done everything the way I instructed, to restart Nagios, you can enter this at the prompt:
sudo -s
cd ~/Desktop
./Validate Nagios.sh
./Restart Nagios.sh
Don’t forget tab completion! For the above, you can type “./V” and press [TAB] and it will auto-complete the rest for you.
What Have I Done?
Whew, that seems like a lot of work, doesn’t it? It’s worth it though. You haven’t even begun to touch the power of Nagios, and it can monitor a whole lot more than just itself and your Windows systems. You’re not going to find that kind of power in another system that can run inside such a lean virtual machine at this price point. In a follow-up post, we’ll go over setting up more detailed monitoring. In the meantime, start learning the system and setting up your own monitors.


Not a DOJO Member yet?
Join thousands of other IT pros and receive a weekly roundup email with the latest content & updates!






9 thoughts on "How to Monitor Hyper-V Using Nagios"
Awesome, thank you!
Thanks for the article, it is a great cookbook for getting a Nagios server running from scratch. It is a little short on detail for Hyper-V though. The article doesn’t say what sort of performance metrics are monitored by Nagios. It mentions services and the screen shot shows some services in different states that but what services should be monitored for Hyper-V? Can it monitor any other Hyper-V specific health?
Thanks, Joel.
Hi Joel,
What? Ping isn’t enough?
Seriously though, the article content evolved as it was created… over a couple of weeks. The title is no longer as well-matched to the content as I would have liked. It’s already pretty long in terms of length and readability, so I decided to clip it at installation and basic introduction. There’s a lot there to digest and I encourage all readers to really look at those configuration files because I’m certain there are uses that I haven’t seen or thought of yet.
The simple answer to your question is that you can use Nagios to monitor just about everything about Hyper-V health. There will be at least one follow-up article that will be dedicated to showing various ways to leverage Nagios and NSClient to do that.
Great article! I just didn’t understand well – did you install Ubuntu on Windows server 2008 or 2012? You are mentioning both of them.. and – if 2012, you used VHD disk, right?
The hypervisor was 2012, now 2012 R2. The problem was that 13.04 performed horribly. I have no idea how 14.04 works yet. I only mentioned 2008 R2 to explain one reason why I didn’t use the 64-bit distribution. But, I have deployed Nagios as a guest on 08R2, 12, and 12R2.
I used VHDX. The only reason I can think of not to use VHDX is if you intend to allow the VM to run on 2008 R2 or if you will want to open the VHDX in a Windows OS that can’t read VHDX, like Windows 7.
Hello Eric,
Great article, I did this on a hyper-v 2012 r2 server and used an Ubuntu Server 18.04 install. I can send instructions on preparing both Ubuntu and Windows Server 2012 for this type of setup. I have a lab at home and do a lot of this config type stuff when ever I encounter it. For self Learning of course. I have recently Installed a Bramble Box with 4 Raspberry PIs clustered as a Docker Swarm and then stand Alone Raspberry PI as my Nagios Box. It’s a really cool setup. So those of you who have questions pertaining to what Eric has explained. I would be glad to help teach the steps as needed. My way of giving back to the community.