Save to My DOJO
Table of contents
Metering is one of those unpleasant yet essential parts of systems administration. If you don’t know anything about your systems’ resource utilization, you can’t properly design their replacements. If you haven’t been keeping track, you won’t be able to answer the question, “What happened” when things go awry. If you aren’t keeping a close eye, you won’t have any advance warning before something collapses in the middle of a major production cycle. When it comes to networking, you’re probably not going to believe how easy it is to get MRTG up and running.
My impetus for writing this particular article is twofold. The first, and most important reason, is that you need to be aware of your systems’ activities. It’s really just that simple. The second reason is that I see entirely too many articles insisting that you absolutely must upgrade all of your systems to a minimum of 10GbE immediately or you’ll be personally responsible for the collapse of civilization. For 90%+ of you, that’s complete hogwash and I’m going to help you prove not only that it’s false, but that it’s ridiculously false. For the <10% of you for whom it’s true, I can help you prove that as well so you can finally demonstrate that you really do need that hardware. Everyone wins (except the people whose income relies on over-selling networking hardware).
You can install MRTG on Windows but I don’t know how and I’m not particularly interested in trying. Installation on Linux, at least Debian-based distributions, is incredibly simple. In the writing of this post, I used a virtual machine that I created just for MRTG by following the instructions in my earlier Getting Started with Ubuntu Linux Server on Hyper-V post. For my lab environment that monitors all my systems, it hovers at just under 800MB of memory demand, to help you size it.
What is MRTG?
MRTG stands for “Multi Router Traffic Grapher”. It does two things:
- Periodically reads traffic information from network devices using SNMP
- Converts gathered data into html pages with png images.
Here’s a quick sampler of what you get:
This is a graph for a single switch port. The blue line represents outgoing traffic on that port (to the connected computer adapter). The green portion shows traffic inbound to the switch port from the computer system. If you’re green-blue colorblind, the squiggly line that hovers around 10.0k in the above image is the blue. The green portion is not a line, but like a bar graph without any spaces between the data points. In the above image, that green portion is hovering below 5.0k. Not being green-blue colorblind myself, I don’t know how tough it is to make the distinction in other cases, but I’m assuming that the blue line always appears darker than the green portion and the green portion always appears darker than the white background.
I’ll tell you right now that I am not an expert on MRTG. There are a great many things it can do that I have not yet explored and probably a great many others that I don’t even know about. I’m just going to talk about network device traffic monitoring in the initial version of this post. I’ll likely continue to explore its powers on my own and will return here if I have any further ideas worth sharing. For now, we’re going to go the easy route because I want you to see just how easy this is.
Metering versus Monitoring
I’m being very careful here with my terminology. In the wild, I don’t think people make that much of a distinction between metering and monitoring, but here it’s important. A real monitoring system would not only pay attention to what the systems are doing, but would also have some sort of notification mechanism at a minimum and possibly a remediation system. If there’s an outage, MRTG just keeps reporting its last good data pull (this can be changed, but the reasoning behind it is solid; read the documentation for more information). I do intend to write another post that helps you set up a monitoring system on Linux, but those are a lot harder to work with than MRTG and I think this is something you’d probably like to have up and running quickly.
Install MRTG on Ubuntu Server
Assuming you’ve got your Ubuntu Server running as indicated in the previously linked post, there’s very little to do to get MRTG running. If you read the information on the site that I linked, it talks all about acquiring and compiling and all sorts of other things. That’s unnecessary on our systems. I do agree with the general consensus of the Linux community that you shouldn’t be afraid of learning how to compile software from source code, but that sort of thing is really not appropriate for even a small data center. I don’t mind doing it once in a while, as in, for my own personal Linux station. There’s just no way that I’m going to get into that maintenance nightmare for all my servers. So, if you share my opinion, don’t worry. That’s not necessary for MRTG in Ubuntu.
First, we need a web server (you could do this afterward if you rather, but I like having MRTG’s environment ready to go). To the best of my knowledge, the Apache web server is still the go-to web solution for Linux systems. It’s changed quite a bit through the years, but is still more than simple enough for what we need to do.
Note: almost everything we’re doing requires SUDO, so I’m assuming you entered sudo -s . If not, you’ll have to prepend sudo to all these commands.
Install Apache:
apt-get install apache2
This will create the necessary folder structure for the web server. We’ll have MRTG place its generated files in a location that is easy for Apache to serve. Create that directory:
mkdir /var/www/mrtg
Apache doesn’t need a whole lot of configuration, but we do need to make sure that we can force documents to expire as we need or your updated graphs won’t automatically be shown. The first part of that is to install the necessary Apache module:
a2enmod expires
You’ll be told you need to restart Apache, and you do, but let’s configure the refresh items first. Use anything you want to edit the following file: /etc/apache2/sites-available/000-default.conf. I use nano:
nano /etc/apache2/sites-available/000-default.conf
The server I’m building will do nothing except operate MRTG. There are, of course, other options. You could have MRTG run in a webpage alongside others. You could have a central Apache server (or IIS, or anything) that MRTG copies its files to. If that’s your goal, you’ll need to do some independent research to figure out how to set it all up. I’m just going to show you how to have Apache running locally and serving the MRTG folder as its default site. It should be a good starting point for you if you do want to get fancy. Edit the file this way (50% of the content is already there, so take care to look for the new lines):
<VirtualHost *:80>
        # The ServerName directive sets the request scheme, hostname and port t$
        # the server uses to identify itself. This is used when creating
        # redirection URLs. In the context of virtual hosts, the ServerName
        # specifies what hostname must appear in the request's Host: header to
        # match this virtual host. For the default virtual host (this file) this
        # value is not decisive as it is used as a last resort host regardless.
        # However, you must set it for any further virtual host explicitly.
        #ServerName www.example.com

        ServerAdmin webmaster@localhost
        DocumentRoot /var/www/mrtg

        # Available loglevels: trace8, ..., trace1, debug, info, notice, warn,
        # error, crit, alert, emerg.
        # It is also possible to configure the loglevel for particular
        # modules, e.g.
        #LogLevel info ssl:warn

        ErrorLog ${APACHE_LOG_DIR}/error.log
        CustomLog ${APACHE_LOG_DIR}/access.log combined

        # For most configuration files from conf-available/, which are
        # enabled or disabled at a global level, it is possible to
        # include a line for only one particular virtual host. For example the
        # following line enables the CGI configuration for this host only
        # after it has been globally disabled with "a2disconf".
        #Include conf-available/serve-cgi-bin.conf

        <IfModule mod_expires.c>
                <Files "*-day.png">
                        ExpiresActive On                  # enable expirations
                        # five minutes
                        ExpiresDefault M300
                </Files>

                <Files "*-week.png">
                        ExpiresActive On
                        ExpiresDefault M1800
                </Files>

                <Files "*-month.png">
                        ExpiresActive On
                        ExpiresDefault M7200
                </Files>

                <Files "*-year.png">
                        ExpiresActive On
                        ExpiresDefault M86400
                </Files>

                <Files "*.html">
                        ExpiresActive On
                        ExpiresDefault M300
                </Files>

                # index.html is not automatically generated
                <Files "index.html">
                        ExpiresActive Off
                </Files>
        </IfModule>
</VirtualHost>

# vim: syntax=apache ts=4 sw=4 sts=4 sr noet
What this does:
- Change the DocumentRoot from “/var/www/html” to “/var/www/mrtg”. This way, accessing the system on port 80 using anything with automatically take you to the MRTG front-end. If you want to use a particular host header, you need different <VirtualHost> entries.
- Add the expiration configuration information for the files within this particular virtual host. These were taken directly from the MRTG documentation.
You can start the Apache2 service now if you like, but it doesn’t have anything to serve. Since I’m going to have you do many other things, let’s do it now so that we don’t forget later:
apachectl restart
Installing MRTG is as simple as installing Apache:
apt-get install mrtg
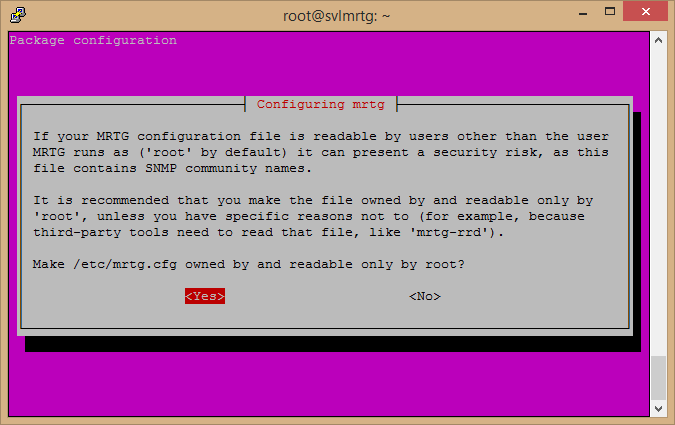
You’ll be asked about securing the MRTG configuration file. I’ll leave this up to you. I don’t have any other accounts on my Linux system so its not a big problem for me either way. Also, the configuration file is simple enough to edit that I don’t mind using Nano locally. There are some more involved configuration files that I’m going to show you how to create, but I’m also going to use NPP remotely to do it and security won’t be as important. So, I say Yes here, but no criticism if you go a different way. If you want to reduce the security problem, only use MRTG with read-only communities:
That’s the only question that there is. After answering it, the package will be installed and configured.
Enabling a System to be Metered
I’m started my metering with my lab’s core switch because it’s really easy to configure. It has a web-based configuration tool with an SNMP tab. All I had to do was designate a community string, the access level, and set it to enabled. While every device and operating system is different, this is the general process you’ll find on all systems.
- Community: The community name, or “community string”, serves two purposes. It is what the local SNMP “listens” for SNMP requests on and it serves as its own password. The defaults for SNMP communities are often “public” and “private”, with “public” being read-only and “private” being read-write. If a community is set with the string “private” and in read-write mode, any remote system connecting over SNMP that uses this community will be able to read anything exposed by SNMP and change any writable options. That’s potentially dangerous, and SNMP security isn’t especially robust. MRTG doesn’t need access to a read-write community. The best thing to do is create a read-only community that you will only use for MRTG. For the purposes of this post, I am creating one simply named “mrtg” and using that on all systems.
- Access level (or “Rights”): As discussed under the Community section, you can choose between Read-Only or Read/Write. Read-Only is all that’s required for MRTG.
- IP Restrictions: Most systems will allow you to restrict which IPs they will communicate with over SNMP. This helps limit your security exposure. I have assigned a DHCP reservation for my MRTG system, so I can lock down SNMP communications to that IP address. If someone managed to spoof the MAC address or IP address, they would be able to read the SNMP information on my target systems.
Installing SNMP on Windows
Windows can’t be monitored by SNMP until you enable it. This can be done by locating SNMP in the Features section of the Add Roles and Features Wizard. Of course, it can also be done via PowerShell. The following is the script I used to enable SNMP on several systems at once:
@('svdc1', 'svdc2', 'svhv1', 'svhv2', 'svmanage', 'svstore') | foreach { Add-WindowsFeature -Name RSAT-SNMP, SNMP-Service, SNMP-WMI-Provider -ComputerName $_ }
The Windows firewall doesn’t appear to block SNMP. For hardware or third-party software firewalls, you’ll need to open UDP port 161 from the MRTG system to the metered target.
Configuring a Windows System via GPO
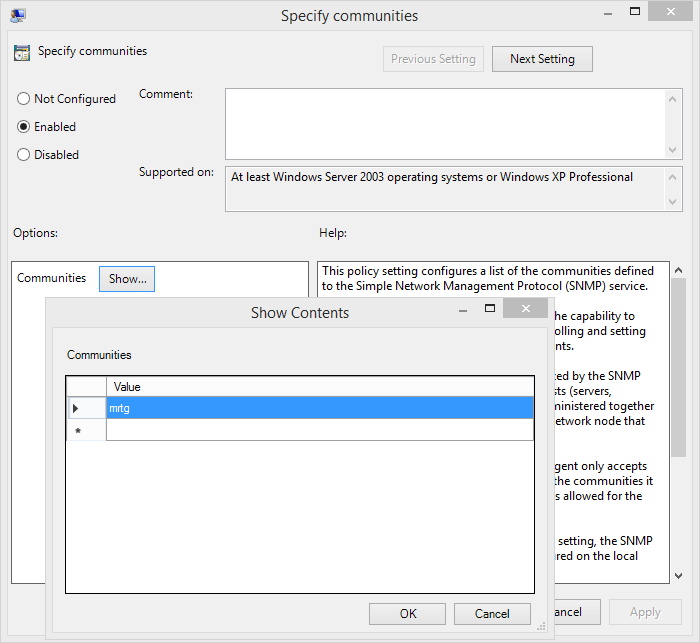
I configure all of my Hyper-V Server and Windows Server systems through Group Policy. You can find the relevant settings at Computer Configuration -> Policies -> Administrative Templates -> Network -> SNMP. If you do this, be aware that it removes anything configured locally in favor of its own settings. You cannot specify read/write communities through Group Policy.
For Specify communities, you add as many entries as needed as follows:
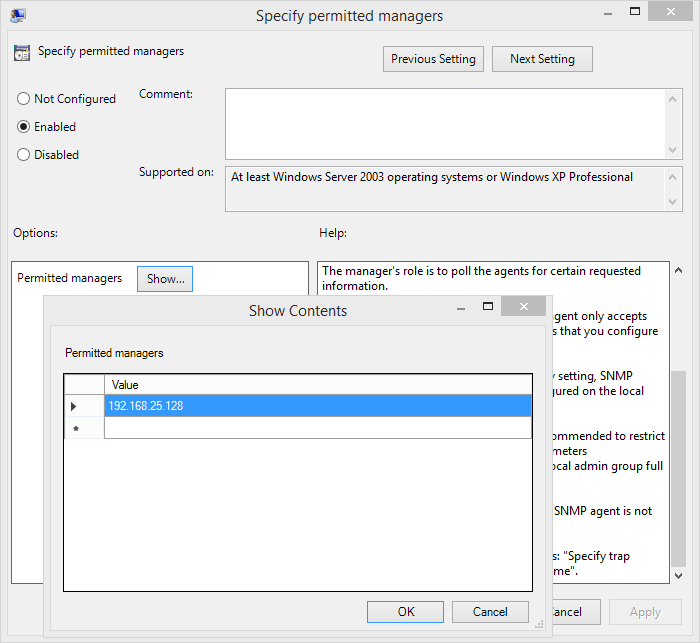
Use Specify permitted managers to restrict the remote systems that can communicate over SNMP:
You do not need to configure Specify traps for public community to use MRTG.
Configuring a Windows System Manually
To manually set up a Windows system:
- Open up the Services.MSC applet (this can be run on a GUI system and remotely connected to a non-GUI system).
- Double-click the SNMP Service item (it will only appear if it’s been enabled).
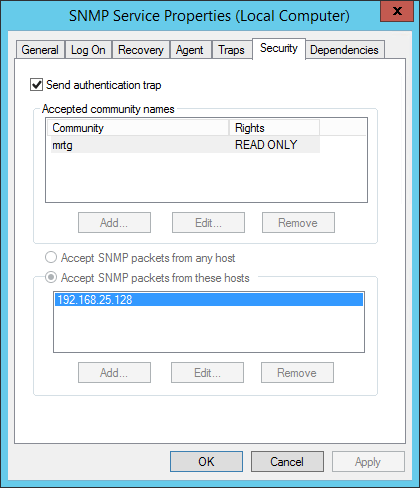
- Switch to the Security tab.
- Use Add in the Accepted Community Names section to add the community name to use for your MRTG system.
- Use Add in the lower section to set the IP address of your MRTG system.
This screenshot was taken from one of my hosts. All its controls are disabled since I used Group Policy, but the outcome would otherwise be the same. It doesn’t matter if you check Send authentication trap or not.
Initial MRTG Configuration
There are two tools you’ll use to set up your MRTG deployment, and we’re going to partially automate both of them later. First, let’s manually input some basic information just to be sure everything is working.
CFGMAKER
The ‘cfgmaker’ tool sets up MRTG to connect to the desired target systems and gives it some formatting hints. For now, let’s just use it to connect to a single system. The IP I’m entering is that of my core switch. It’s not shown here, but you do need to be at sudo level because any lower accounts can’t write to the output locations.
cfgmaker --global 'WorkDir: /var/www/mrtg' --global 'Options[_]: bits, growright' --output /etc/mrtg.cfg [email protected]
This is pretty straightforward, with one exception. The first global option is the working directory, which is where the generated html and png files will be placed. It’s the same location that we set Apache to serve by default. The second global option is a couple of flag items; I want the display in bits per second and I want the newest information on the right instead of the left. Next, the output parameter tells cfgmaker where to drop the configuration file that it creates. Our installation is looking in /etc for mrtg.cfg, so that’s where we’re going to put it. After that, it gets a little bit confusing. There are no named parameters to specify the systems to be monitored. You just start listing items. I’m going to show you a more maintainable way to do this later. For now, just enter one system so we can do testing. The format is communityname@DNSorIP.
Upon pressing enter, cfgmaker will “walk” the target system(s), discovering its exposed SNMP properties. There will be a lot of text scrolling by. Go back through it, looking for any errors. I noticed that Perl has a lot of warnings about the cfgmaker script itself, but that’s outside your control. Look for any complaints about the target devices and correct any indicated issues. Resubmit the command until it goes through (the arrow up key recalls previous commands in Linux just as it does in Windows).
You are free to open up /etc/mrtg.cfg in nano or any other editor to see what happened. Every time that MRTG runs, it will check the remote systems in this file.
INDEXMAKER
MRTG will auto-generate the system pages and graphics at each iteration. What it doesn’t do is build an index.html to serve them all centrally. You can manually do that if you want, but MRTG has a tool for it. You only need to run this if you change the display information or if you add systems. There are many parameters on it that I do not use. As with cfgmaker, you need sudo power. Here’s my entry:
indexmaker --output=/var/www/mrtg/index.html /etc/mrtg.cfg
Manually Running MRTG
Once you have the configuration files set, let’s test MRTG by running it manually (still with sudo):
env LANG=C mrtg /etc/mrtg.cfg
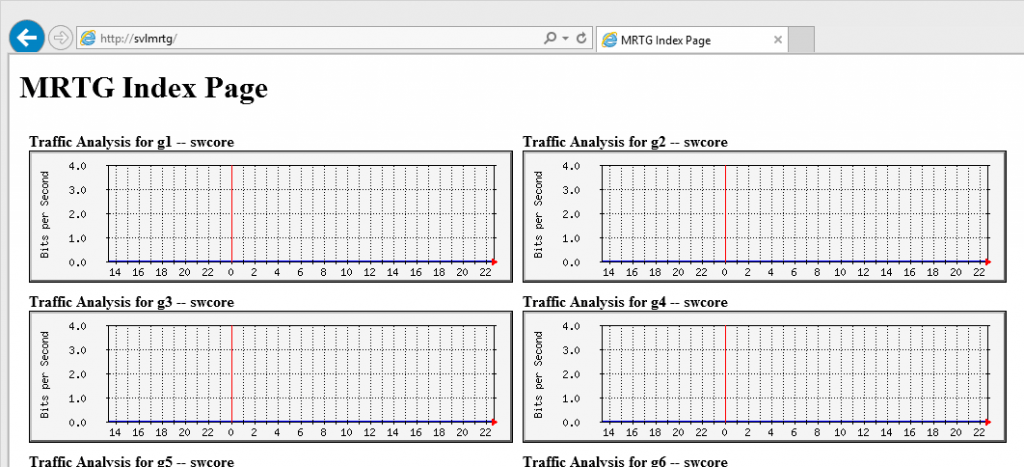
Yes, the “env LANG” portion is necessary. If you try running MRTG without it, you’ll get an error. I don’t fully understand it and I didn’t research it. I just know that following its advice and adding this prefix works. On the very first run, you’ll get a lot of warnings that it can’t rename several files; that’s just because they don’t exist yet. Once it’s finished and back to the command line, you should be able to open the host’s page in your web browser:
That’s pretty boring with only a single data point, isn’t it? It will get better over time. What you’re looking at is a separate graph for each port on my switch. If you click any one of them, you’ll go to that port’s page which, eventually, will have more data — up to a year’s worth.
Now that we’re sure that MRTG works, let’s start adding some things and dressing it up.
Automating MRTG Configuration
It’s really easy to just add items, but re-generating the configuration files at each go would get tedious quickly. Let’s reduce that typing to a minimum.
The way I did this was by creating a file in my home directory (~ or, in my case, /home/eric) NOTE: If you are in SUDO mode, exit before you do this or NPP won’t be able to work with the file:
touch ~/cfgmrtg
chmod +x ~/cfgmrtg
All this does is create an empty file named “cfgmrtg” in my home folder and make it executable. From here, I use NPP remotely to manage it (see the initial Linux setup post if you’re not sure how to do this). Don’t forget to set it to a UNIX EOL conversion.
Let’s start by fleshing this out with all the different systems that we want to connect to. Set the contents of your cfmrtg file to something like this:
#!/bin/sh
cd /usr/bin

cfgmaker --global 'WorkDir: /var/www/mrtg'
	--global 'Options[_]: bits, growright'
	--output /etc/mrtg.cfg
	[email protected]
	[email protected]
	[email protected]
	[email protected]
	[email protected]
indexmaker --output=/var/www/mrtg/index.html /etc/mrtg.cfg --perhost
The first line tells the shell to process this file using the shell interpreter. The second line tells it to switch to /usr/bin, which is where the actual cfgmaker and indexmaker scripts live; this isn’t strictly necessary, but I like to be complete.
The cfgmaker line is a lot like the one I had you run in the previous section but we’ve broken it out over several lines using the line continuation character (). Remember not to use it on the last line!
The indexmaker line should also look a little familiar. I’ve added the perhost parameter to clean up the output a bit.
From now on, any time you want to make changes to your MRTG build, edit this file using anything you want — NPP, nano, whatever. Then run it like this:
sudo ~/cfgmrtg
Running MRTG Automatically
There are a couple of ways to get MRTG to run automatically. It does have a service mode. That requires setting up init.d, which I have never really figured out how to do with any certainty. Most of the “documentation” on that basically says, “Oh just do it like you always do it.” That would be a lot more helpful had I ever done it before. It sounds like it should be really easy, but I don’t know how. So, instead, I use the cron method. cron is the timer service in Linux; it’s essentially like using Scheduled Tasks in Windows. The MRTG documentation says that using the service mode is less resource-intensive because the service mode only reads the configuration files when the service is started. Whatever savings there are, I’m sure they’re minimal. Most of the process load is not going to be in reading configuration files, but in the fact that it’s reaching out to all those network devices. The best part about using cron is that if you change the configuration in any way, it will automatically pick those changes up at the next interval. No restarting of services.
The following starts up cron in interactive mode for the root user (on the system that I showed you how to set up in the previous post; different distributions may behave differently):
sudo crontab -e
You’ll be asked which editor to use to set up your cron information. I always use 2 for nano because, as it says, that’s easiest.
In that screen, go to the end of the file and enter the following on a blank line. It creates a cron job as the current user (root, remember?) to run MRTG every five minutes, polling all the systems in the mrtg.cfg file you set up (this also might not work in non-Debian distributions, I don’t know):
*/5 * * * * env LANG=C /usr/bin/mrtg /etc/mrtg.cfg --logging /var/log/mrtg/mrtg.log
Note: if you paste the above into a PuTTY session, it’s going to come out looking really strange. That’s just how nano handles lines longer than the screen. All is well. You can use the arrows and other navigation keys to move around and verify.
Assuming you edited in nano, press [CTRL]+[X] to exit, [Y] to save, and [Enter] to use whatever file name it suggests. You’ll be left at the command prompt.
Now, just wait five minutes. Polling is automatic from here and survives restarts.
What You’re Looking At
In the steps and configuration files I’ve shown you, my Hyper-V hosts are included along with the switch that they’re plugged into. If you did the same, you’re looking at a long mess of ports. It’s going to be a little tough at first to sort out what is what. From the index page, click on any of the ports for your Hyper-V host. You should get something like this:
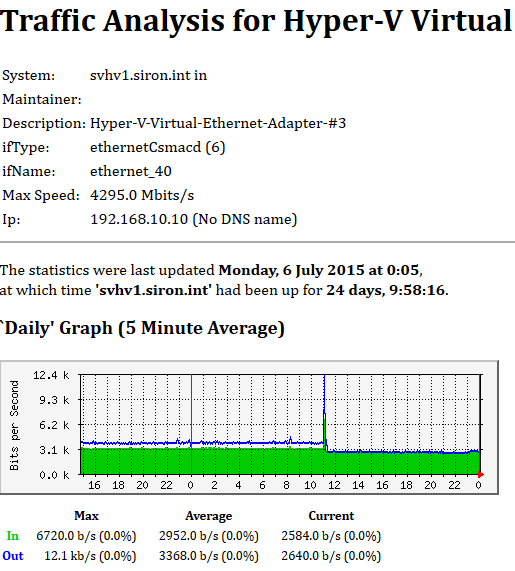 My traces have been running for a while so my graph is more populated than your new one will be, but that’s not what I want you to look at right now. Look at the top at ifname. That’s what’s important at the moment. Connect to your Hyper-V host in PowerShell and issue the following (use the InterfaceName that MRTG shows for your system):
Get-NetAdapter | ? InterfaceName -eq 'ethernet_40'
You’ll get something like this (the ? is an alias for Where-Object):
 Since I give all my adapters a descriptive name in Windows, I now know that this particular graph is for the adapter I designated to carry cluster traffic, so I know that adapter talks a lot and averages about 3.1 kilobits of traffic per second.
Teamed adapters are quicker to identify. They’ll show up as Multiplexor Driver. Of course, you can use the same matching process as shown above to verify that.
So, when some sales guy comes pounding on my door or some not-quite-with-it blogger delivers some shameful screed, breathlessly demanding that he be considered for a Nobel prize for saving us all from the pits of 1GbE slowness, I can whip out my nifty little chart and ask, “Where here do you see any indicator that 1GbE isn’t good enough?”:
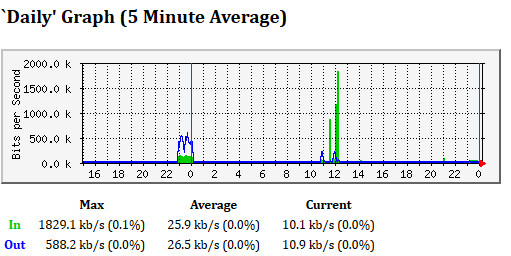 Of course, I must concede that the exact chart shown is for my lab environment. But, I inherited a nice MRTG installation at the medium enterprise I used to work for (400 users) and it wasn’t exactly filling up the white space either. Had I known just how easy this configuration was, I would have shown you all this years ago (although maybe it was harder then).
Improving MRTG Output
What you have now is plenty to figure out everything you absolutely need to know. However, you’re going to get a whole lot of data that is irrelevant and that you have to spend a lot of time sorting out.
So, let’s make a new configuration file. This will be a filter that MRTG will apply when building the graphs. NOTE: remember NOT to do this with SUDO if you want to use external editors:
touch ~/mrtgfilter
Before you start working on that file, edit your ~/cfgmrtg file to reference it. Here’s mine:
#!/bin/sh
cd /usr/bin

cfgmaker --global 'WorkDir: /var/www/mrtg'
    --global 'Options[_]: bits, growright'
    --ifdesc=descr
    --if-template=/home/eric/mrtgfilter
    --output /etc/mrtg.cfg
    [email protected]
    [email protected]
    [email protected]
    [email protected]
    [email protected]
indexmaker --perhost --output=/var/www/mrtg/index.html /etc/mrtg.cfg
Note 1: The order is important. If a target entry comes before a non-global item, then it will not receive that configuration. So, if I were to push the [email protected] line above the if-template line, it wouldn’t be run through the template.
Note 2: I was tinkering with the ifref= line, which changes how the names of ports are displayed. It wound up being a total waste of time for me, but when you do that, it invalidates all your old image files. I could have fixed it with a rename operation, but I didn’t. I wouldn’t change ifref unless you really really really know what you’re doing. See the MRTG page for more information.
So, let’s get to work on that filter. This is a Perl script, and I’ll tell you now that I don’t know Perl at all. I used the starter material and found that, fortunately, my PowerShell knowledge applies pretty well to Perl:
if($if_ok) # it was already planning to include this interface
{
	# exclude Windows adapter types that we don't want to see
	if($if_snmp_descr=~'LightWeight-Filter|QoS-Packet-Scheduler|Hyper-V-Virtual-Switch-Extension|Microsoft-Network-Adapter-Multiplexor-Driver-Microsoft-Load-Balancing/Failover-Provider')
	{
		; # do nothing
	}
	else
	{
		$target_lines=$default_target_lines;
	}
}
I’ve highlighted the only line that I think really needs further explanation. The “$if_snmp_descr” is a variable that exists in the MRTG script. That field is shown with the label Description when you click to the port’s page. The “=~” immediately after that signals to Perl that it needs to use a regular expression match. After that is the string to match. Within a regular expression, the pipe character (|) means “or”. So, I’m just looking inside the description for any of those items. If it’s found, I tell MRTG to do nothing — this means that the item is not displayed. For anything else, I pass it along to the default handler, which will set up the graphs and index pages and so on. I can keep editing this line or use “elsif”s to add further conditions.
Once you’ve done this, just run your cfgmrtg script (~/cfgmrtg) and refresh or load the page in your browser. All those pesky lines will be gone and the good stuff will be left.
Making it Even Better
Of course, I wasn’t satisfied with just paring down the list. I was looking at all those non-descript names and then having to match them up manually with their friendly names. That sort of work just won’t do. So, I rewired it. Here’s my modified mrtgfilter file:
if($if_ok) # it was already planning to include this interface
{
	my $new_descr = $if_snmp_descr;	# if the interface matches a known named interface, the SNMP description will be replaced with a custom label
	my $write_custom_descr = 1;	# for now, assume that there is custom HTML to write. otherwise, this will be set to 0 and the defaults will be used

	# watch for core switch interfaces in order to rename them
	if($router_name=~'swcore')
	{
		## filter by interface description to set the name
		# perl doesn't seem to have a stable "switch" or alternative, so ifelsifelsifelsifelsif it is
		if($if_snmp_name eq 'g1') { $new_descr = 'Uplink to Internet Router'; }
		elsif($if_snmp_name eq 'g2') { $new_descr = 'SVHV1 Onboard'; }
		elsif($if_snmp_name eq 'g3') { $new_descr = 'SVHV2 Onboard'; }
		elsif($if_snmp_name eq 'g4') { $new_descr = 'SVSTORE Onboard'; }
		elsif($if_snmp_name eq 'g5') { $new_descr = 'SVHV1 PCI Top Left (Storage)'; }
		elsif($if_snmp_name eq 'g6') { $new_descr = 'SVHV2 PCI Top Left (Storage)'; }
		elsif($if_snmp_name eq 'g7') { $new_descr = 'SVHV1 PCI Top Right (Storage)'; }
		elsif($if_snmp_name eq 'g8') { $new_descr = 'SVHV2 PCI Top Right (Storage)'; }
		elsif($if_snmp_name eq 'g9') { $new_descr = 'SVHV1 PCI Bottom Left (VM Team)'; }
		elsif($if_snmp_name eq 'g10') { $new_descr = 'SVHV2 PCI Bottom Left (VM Team)'; }
		elsif($if_snmp_name eq 'g11') { $new_descr = 'SVHV1 PCI Bottom Right (VM Team)'; }
		elsif($if_snmp_name eq 'g12') { $new_descr = 'SVHV2 PCI Bottom Right (VM Team)'; }
		elsif($if_snmp_name eq 'g13') { $new_descr = 'SVSTORE PCI Top (Storage)'; }
		elsif($if_snmp_name eq 'g14') { $new_descr = 'SVSTORE PCI Bottom (Storage)'; }
	}
	# exclude Windows adapter types that we don't want to see. catch this before any other expensive matches
	elsif($if_snmp_descr=~'LightWeight-Filter|QoS-Packet-Scheduler|Hyper-V-Virtual-Switch-Extension|Microsoft-Network-Adapter-Multiplexor-Driver-Microsoft-Load-Balancing/Failover-Provider')
	{
		$write_custom_descr = 0; # do nothing
	}
	# next series of elsifs will watch for particular Windows hosts to rename their interfaces
	elsif($router_name=~'svhv1')
	{
		if($if_snmp_name eq 'ethernet_10') { $new_descr = 'PCI Bottom Right (VM Team)' }
		elsif($if_snmp_name eq 'ethernet_14') { $new_descr = 'Management' }
		elsif($if_snmp_name eq 'ethernet_18') { $new_descr = 'PCI Top Right (Storage)' }
		elsif($if_snmp_name eq 'ethernet_22') { $new_descr = 'PCI Bottom Left (VM Team)' }
		elsif($if_snmp_name eq 'ethernet_24') { $new_descr = 'VM Team' }
		elsif($if_snmp_name eq 'ethernet_26') { $new_descr = 'PCI Top Left (Storage)' }
		elsif($if_snmp_name eq 'ethernet_30') { $new_descr = 'Live Migration' }
		elsif($if_snmp_name eq 'ethernet_40') { $new_descr = 'Cluster Communications' }
	}
	elsif($router_name=~'svhv2')
	{
		if($if_snmp_name eq 'ethernet_10') { $new_descr = 'PCI Top Left (Storage)' }
		elsif($if_snmp_name eq 'ethernet_12') { $new_descr = 'VM Team' }
		elsif($if_snmp_name eq 'ethernet_14') { $new_descr = 'PCI Top Right (Storage)' }
		elsif($if_snmp_name eq 'ethernet_18') { $new_descr = 'Management' }
		elsif($if_snmp_name eq 'ethernet_22') { $new_descr = 'PCI Bottom Left (VM Team)' }
		elsif($if_snmp_name eq 'ethernet_26') { $new_descr = 'PCI Bottom Right (VM Team)' }
		elsif($if_snmp_name eq 'ethernet_32') { $new_descr = 'Live Migration' }
		elsif($if_snmp_name eq 'ethernet_40') { $new_descr = 'Cluster Communications' }
	}
	else
	{
		$write_custom_descr = 0;
		$target_lines=$default_target_lines;
	}
	if($write_custom_descr)
	{
		# sanitize description field for output
		$new_descr = html_escape($new_descr);
		$target_lines .= <<ECHO;

Target[$target_name]: $if_ref:$router_connect
SetEnv[$target_name]: MRTG_INT_IP="$if_ip" MRTG_INT_DESCR="$new_descr"
ECHO

		if ($directory_name) {
			$target_lines .= "Directory[$target_name]: $directory_namen";
		}

		$target_lines .= <<ECHO;
MaxBytes[$target_name]: $if_speed
Title[$target_name]: $html_desc_prefix$html_if_title_desc -- $sysname
PageTop[$target_name]: <h1>$html_desc_prefix$new_descr -- $sysname</h1>
	<div id="sysdetails">
		<table>
			<tr>
				<td>System:</td>
				<td>$sysname in $html_syslocation</td>
			</tr>
			<tr>
				<td>Maintainer:</td>
				<td>$html_syscontact</td>
			</tr>
			<tr>
				<td>Description:</td>
				<td>$new_descr</td>
			</tr>
			<tr>
				<td>ifType:</td>
				<td>$html_if_type_desc ($if_type_num)</td>
			</tr>
			<tr>
				<td>ifName:</td>
				<td>$html_if_snmp_name</td>
			</tr>
ECHO

		$target_lines .= <<ECHO if defined $if_port_name;
			<tr>
				<td>Port Name:</td>
				<td>$if_port_name</td>
			</tr>
ECHO

		$target_lines .= <<ECHO if defined $if_pp_port_name;
			<tr>
				<td>Port Name:</td>
				<td>$if_pp_port_name</td>
			</tr>
ECHO

		$target_lines .= <<ECHO;
			<tr>
				<td>Max Speed:</td>
				<td>$if_speed_str</td>
			</tr>
ECHO

		$target_lines .= <<ECHO if $if_ip;
			<tr>
				<td>Ip:</td>
				<td>$if_ip ($if_dns_name)</td>
			</tr>
ECHO

		$target_lines .= <<ECHO;
		</table>
	</div>
ECHO
	}
}
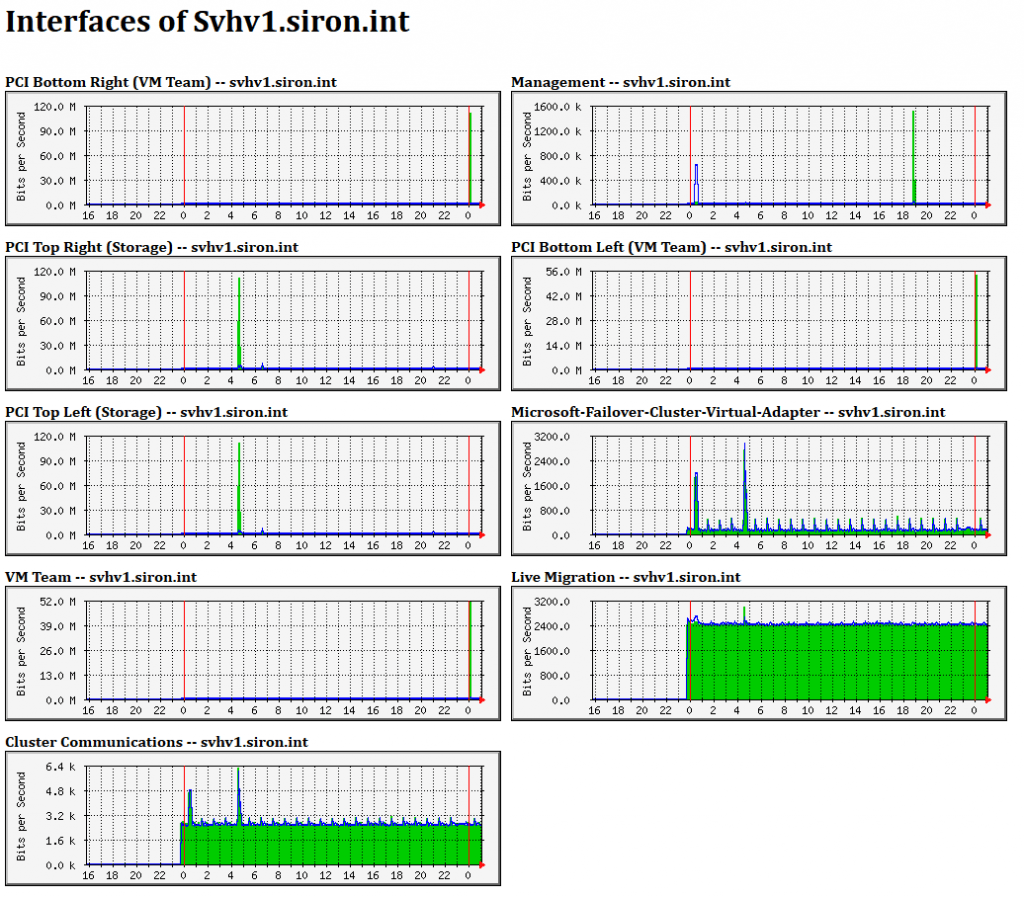
There’s a lot of script there, but I’ve done all the really hard work for you. Most of it can just be copy/pasted into your own filter file. The highlighted parts are the ones that you would want to modify to work with your own systems. Probably the easiest way to get the necessary information is to run Get-NetAdapter | select Name, ifName and work from that list. Alternatively, you can add in a target and get MRTG to load it up. Then, you look at the interface pages for that system and match them up with the information as I showed you in the “What You’re Looking At” section. However you get your information, modify this file accordingly by following the templates that I’ve laid out. Your reward will be something like this:
Right away, I know exactly what I’m looking at. I can see that I haven’t done any Live Migrations since I began metering these hosts. I can see that cluster communications are being very evenly balanced across the two networks I have enabled for it. Although it wasn’t as clear once I got around to taking the screenshot, I did do an NTttcp test between two of my guests for a minute and the graphs showed a nice even balancing of traffic across my teamed adapters. What I can really see is that 10GbE would be an utter waste of money in this environment. Although it wasn’t my goal in this post, I can also look at the activity on my storage adapters and see that getting worried about the performance difference of fixed vs. dynamically expanding VHDXs and my RAID design and fragmentation and anything else people wring their hands about is also not worth my time.
A Note on Metering VM Adapters
I definitely recommend that you set up watches directly on the Hyper-V guests if at all possible. As you’ve seen, you can watch the physical adapters that the Hyper-V virtual switch is attached to and, as long as your switch is SNMP-capable, you can watch the physical switch ports that they’re attached to. That’s helpful. But, you also need to be able to break it right down to the level of the virtual adapter. This is especially true in a cluster since the adapter can move and MRTG won’t really be able to display that by watching the switches and hosts. As a general rule, I like to monitor the guests’ performance at the host level and not get the guest operating systems involved. You can use MRTG to do that, but it’s really not easy. What you have to do is configure MRTG to look at the SNMP information coming out of PerfMon. It’s not an insurmountable challenge by any means, but it’s a great deal more effort than what I’ve shown you. Even if you put in all the work, the downside is that MRTG has no mechanism to handle when such an adapter is relocated from its host to another. How it behaves depends on how Hyper-V reports the adapter over SNMP (I don’t know what it does). If it simply stops reporting it, then MRTG is going to follow its convention and repeat the last known data value. That’s just not useful in this case.


Not a DOJO Member yet?
Join thousands of other IT pros and receive a weekly roundup email with the latest content & updates!



24 thoughts on "How to Meter and Track Hyper-V Networking Performance with MRTG"
Hia all
Yes, MRTG is a great tool… But when you’re using Hyper-V, you’re most likely more a Windows than Unix guy and there is a great Windows based software we’ve been using for many years. And it does metering AND monitoring: https://www.paessler.com/prtg. It’s a German product, but available in all languages. It’s now even free for up to 100 sensors.
Ok, this sounds like a huge commercial. Maybe it is, but i can assure you that I am in no way related to the company that makes PRTG. It’s just a tip from a very satisfied customer.
Cheerios, Lukas
Yep, I’m aware of PRTG. I like the idea of it, but once you hit that 100 sensor mark, it falls right off the cliff from free into insanely expensive. 100 sensors is very low point that’s easy to reach. My environment isn’t even a production set and I almost have that many. There are 30 just in the filter that I showed and I intentionally kept that low to improve readability — not to mention the objects that aren’t being filtered. I could easily blow past 100 sensors in a few minutes in all but the smallest environments.
I’m focusing this not-quite-a-series toward people that have a small budget and are willing to trade a small bit of effort for financial savings, and PRTG just doesn’t really fit into that. I don’t have anything bad to say about PRTG, but I think it’s a far better deal for those with the budgets and deployments to justify the unlimited license versus those that are counting every penny and would fall closer to the 500 and 1,000 sensor marks.
You are right – their prices have increased quite a bit since i’ve last looked (i’m just a bit shocked seeing them now): When we bought it first more than 5 years ago, it was much cheaper and maintainance costs are pretty low still. At the moment i monitor 7 hypervisors with multiple storage units, about 50 VMs and another 30 physical servers and i use close to 200 sensors. Ok, i do not use PRTG to monitor ‘low level stuff’ like switch ports… For that i still use ‘PRTG Traffic Grapher’ which is like an MRTG for Windows -> metering only. But that product does not exist anymore (was fused to PRTG ‘full edition’ around 2008) – at least it still works for me.
Hia all
Yes, MRTG is a great tool… But when you’re using Hyper-V, you’re most likely more a Windows than Unix guy and there is a great Windows based software we’ve been using for many years. And it does metering AND monitoring: https://www.paessler.com/prtg. It’s a German product, but available in all languages. It’s now even free for up to 100 sensors.
Ok, this sounds like a huge commercial. Maybe it is, but i can assure you that I am in no way related to the company that makes PRTG. It’s just a tip from a very satisfied customer.
Cheerios, Lukas
Yep, I’m aware of PRTG. I like the idea of it, but once you hit that 100 sensor mark, it falls right off the cliff from free into insanely expensive. 100 sensors is very low point that’s easy to reach. My environment isn’t even a production set and I almost have that many. There are 30 just in the filter that I showed and I intentionally kept that low to improve readability — not to mention the objects that aren’t being filtered. I could easily blow past 100 sensors in a few minutes in all but the smallest environments.
I’m focusing this not-quite-a-series toward people that have a small budget and are willing to trade a small bit of effort for financial savings, and PRTG just doesn’t really fit into that. I don’t have anything bad to say about PRTG, but I think it’s a far better deal for those with the budgets and deployments to justify the unlimited license versus those that are counting every penny and would fall closer to the 500 and 1,000 sensor marks.
Sorry, i can’t edit the post above and forgot to mention this: It’s also very easy to monitor Windows specific stuff using SNMP or WMI – I do monitor, for example memory usage, CPU loads, disk storage usage (free space, IOPS, disk queue length etc). Very very usefull information.
I had the opportunity of using MRTG under CentOS, alongside Nagios and I can attest for its usefulness.
This post is very useful for me and I plan on implementing your solution on a test lab.
Thanks for all the info.
I had the opportunity of using MRTG under CentOS, alongside Nagios and I can attest for its usefulness.
This post is very useful for me and I plan on implementing your solution on a test lab.
Thanks for all the info.