Save to My DOJO
Table of contents
As explained in the previous parts of this article series, we can use Hyper-V Manager to get detailed information about the replication health which includes replication statistical data. The replication health data not only help in troubleshooting the issue but also helps in finding the root cause.
The Part 1 of this article series focused on how to check replication health and Part 2 explained the “Warning” and “Critical” replication health status in detail. Please check out Part 1 and Part 2 of this article series here:
- Part 1 – Using Hyper-V Manager to Check Hyper-V Replication Health
- Part 2 – Understanding “Warning” and “Critical” replication health status
In this article, we are going to focus on interpreting the statistical data provided by the “Replication Health” page and how to use them.
Hyper-V Replication Statistical Data
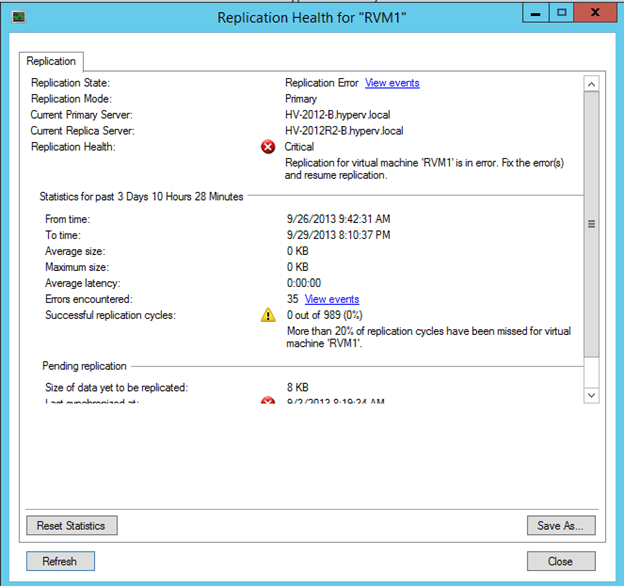
Below shown is the “Replication Health” page for a Primary Virtual Machine. As you can see, “Replication State” column indicates that the virtual machine “RVM1” is in the “Replication Error” and “Replication Health” column indicates “Critical” status.

Apart from “Replication State” and “Replication Health” columns, there are other valuable information provided on the “Replication Health” page as explained below. Interpreting this information will help in finding the root cause.
“Statistics” and “Pending Replication” information shown on the “Replication Health” page are useful when it comes to troubleshoot the issues.
- “From Time” and “To Time” Columns: The statistical information shown here is for a particular time period as indicated by “From Time” and “To Time” columns as shown in the above screenshot. The current statistics shown are for past “3 Days 20 Hours and 10 Minutes” as indicated on the “Replication Health” page.
- The “Average Size” is the size of HRL file which is sent to the Replica Server every 5 minutes.
- The “Maximum size” indicates the maximum size of the HRL file which was sent to the Replica Server in the previous or current interval.
- The “Average Latency” indicates the average time taken to replicate the HRL file to the Replica Server.
- The “Successful Replication Cycles” shows successful replication attempts (0) out of total replication cycles (989). That means there were “no” successful replication cycles for this virtual machine. In other words, Hyper-V Primary Server has not sent anything to Replica Server since last “3 days 10 Hours and 28 Minutes”. Thus, it indicates that 20% of replication cycles have been missed.
“Average size” and “Maximum size” columns show “0 KB”. It is because the Primary Server did not replicate any data for this virtual machine because of the replication errors with this virtual machine in the current replication interval.
Note: The values shown on the “Replication Health” page are not refreshed automatically. You must click on the “Refresh” button to refresh the values.
- “Errors Encountered” column shows the total number of errors encountered for this virtual machine. To see the errors or warning event messages related to this virtual machine you can click on “View Events” as shown on the “Replication Health” page.
- “Pending Replication” page shows the sum of HRL files or replication data which yet to be replicated to the Replica Virtual Machine. This is what Primary Server does. Primary Server continues to track the changes on the Primary virtual machine and replicate them to the Replica Server every 5 minutes.
Resetting Statistics Data
Once you fix the replication issue, you can click on “Reset Statistics” button to reset the values shown on the “Replication Health” page.
The health page also provides you an opportunity to save the replication health data for the virtual machine in a CSV file. You can click “Save As” button on the “Replication Health” Page to save the data.
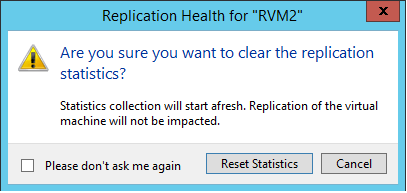
Clicking on “Reset Statistics’” button will show the confirmation window as shown below:

Resetting the values will change the “Replication Health” for the virtual machine to “Normal” but in the next replication cycle virtual machine will be put into “Warning” or “Critical” state if there are still some issues with the replication for this virtual machine.
Clicking on “Reset Statistics” button creates an entry in the event log which contains the replication statistical data. An Event ID 29174 will be generated under Application and Services Logs | Microsoft | Windows | Hyper-V-VMMS | Admin as shown in the below screenshot:
Every click on the “Reset Statistics” button generates an Event ID 29174 provided there is enough information available to save in the Event Log.
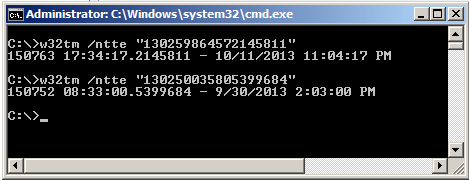
As you notice in the above event log, “StartTime” and “EndTime” shows the decimal values. To convert these values in the human readable format, you can use the below command:
– W32tm.exe /ntte <decimal value>
Running the above command will convert decimal values to human readable values as shown in the below command window:

As shown the command window above, first command is run to convert “StartTime” and the second command is for converting “EndTime” to human readable format. By just looking at the time stamp values you can know that the replication statistical data shown in the message of Event ID 29174 is for more than 2 days ago.
Check Hyper-V status and monitor replication using built-in tools and commands. Hyper-V replication is a critical aspect of maintaining high availability and disaster recovery capabilities for virtualized environments. By regularly checking Hyper-V status and replication health, administrators can ensure that virtual machines are adequately protected and that replication processes are functioning as expected.
Hyper-V replication provides a reliable mechanism for replicating virtual machines between primary and replica servers, ensuring data consistency and minimizing downtime in the event of a disaster. Monitoring Hyper-V replication status allows administrators to identify any issues or discrepancies that may arise during the replication process, allowing for timely intervention and resolution. By staying vigilant and proactive in monitoring Hyper-V replica status, administrators can maintain a robust and resilient virtual infrastructure.
Since this event ID contains the historical statistical data for Hyper-V replication for a specific virtual machine, it helps in troubleshooting or finding root cause. For example, by looking at the previous event log entries, you can get an idea of missed replication cycles by looking at “ReplicationMissCount” attribute as shown in the above screenshot.
Conclusion
This article series focused on checking replication health of virtual machines using Hyper-V Manager which was explained in the Part 1. Part II article explained the different replication health status a Primary virtual machine can enter into. We also highlighted the difference between “Warning” and “Critical” health status and when it is necessary to consider a virtual machine into an actual “Critical” health status.
In the final part of this article series, we learned about the statistical information provided on the “Replication Health” page and how to interpret them for troubleshooting issues with Hyper-V replication.


Not a DOJO Member yet?
Join thousands of other IT pros and receive a weekly roundup email with the latest content & updates!


