Save to My DOJO
If it weren’t for the fact that we don’t fully utilize the hardware in systems that we buy, virtualization would never have reached the level of normative practice that it enjoys today. One resource that has traditionally been over-purchased is memory; it’s always better to have too much memory than too little, but it’s not good to have far too much. The struggle has always been in determining the point of “just enough”. While there is no certain way to achieve balance, Hyper-V’s Dynamic Memory feature can help to reduce the amount that is wasted. As with many solutions, it isn’t always the appropriate tool to use. Unfortunately, that causes some people to avoid it entirely. To not use Dynamic Memory reduces the effectiveness of virtualization as a solution. But, using it properly can be a challenge. This article will provide some pointers for effective implementation.
What is Hyper-V Dynamic Memory?
This post assumes that you have a fairly solid understanding of what Hyper-V Dynamic Memory is. If you don’t feel like you meet that requirement, or if you’d just like a refresher, start with our article that gives a thorough definition of the technology, an Illustrated Guide to Hyper-V Dynamic Memory. We also have an article that covers 10 Best Practices and Strategies for Hyper-V Dynamic Memory here.
The synopsis description that’s important for this post is that Hyper-V’s Dynamic Memory is key to virtual machine density. CPU can be easily oversubscribed and distributed; disk can’t be shared but it is cheap. Memory cannot be shared and it is comparatively expensive, making it the resource where you’ll need to focus if you wish to increase the number of virtual machines on any given physical host.
Sizing Method 1: Take an Application-Centric Approach
Dynamic Memory is a solid, proven feature. It is known to work and its functionality can be demonstrated on demand. You can synthesize tests and reproduce their results. The technology is approaching six years’ worth of field deployment history. The persistent recommendations to never use Dynamic Memory are anachronistic and senseless and the time to stop debating if it should be used is long past. A more suitable use for your time is to determine where it is suited and how it should be implemented. The most efficient way to reach that goal is to examine the applications that will be used in your Hyper-V deployment.
Always Start with Software Vendors
Most software vendors have at least tested their application with VMware’s products and can make some basic recommendations. I do know that a great many of them needlessly recommend that you disable all hypervisor memory management techniques. With an ESXi system, that usually manifests as a recommendation to reserve 100% of the allocated memory. For Hyper-V, the equivalent would be not using Dynamic Memory at all. Ordinarily, I give at least a little push back and ask them to justify that. Some systems really do require all of their memory; those applications are typically virtualized for the purposes of portability and so that the vendor doesn’t have to develop a high availability solution, not for resource oversubscription or sharing. Such systems are rare. A lot of application vendors just don’t put forth the effort to do the necessary testing and don’t have sufficient data to answer your question appropriately.
Put a limit on how hard you push back. Even though these recommendations are usually not justified in practice, vendors will commonly refuse to support installations that do not conform to requirements, even if it can be demonstrated that the issue is not related to configuration.
If the vendor doesn’t know…
Ask Around
Find out if anyone else using your software application is using Dynamic Memory. See what their experiences are. I recommend seeking out communities that are normally populated by those that use the software, not generic Hyper-V communities. Occasionally, people will visit the official Microsoft Hyper-V forums to ask something about virtualizing a particular application, and their questions usually go unanswered or have fewer than four responses. That’s hardly sufficient data. Most other generalized technology forums will have similar results, including a lot of “never use Dynamic Memory” suggestions that you can safely ignore.
Digital forums aren’t your only option. User groups are often a great source of product knowledge. These are common stomping grounds for technophiles that have tested various configurations beyond any degree that most of the rest of us would find desirable and love to share their findings with anyone that will listen. While it’s axiomatic that you should always take amateur advice and anecdotal experiences with a grain of salt, it’s also unwise to completely discount the experiences of others.
Watch Application Behavior
As far as I’m concerned, the ability to track a Windows application’s performance should be a required skill for every IT professional from the help desk staff upwards. Based on the common contents of the queries that I receive, it appears that the world considers it to be an esoteric art, shadowed in the deepest chambers of the syadmin archives, protected by demonic guardians. Well, let me assure you that performance monitoring is not a secret, it is not difficult, and you should know how to do it.
Use Performance Monitor to Track Performance in Real-Time
I’m going to start off by showing you how to track statistics in real-time. It’s not the optimal way to gauge application performance for Dynamic Memory tuning, but it introduces you to the necessary skills of counter selection and display manipulation without showing you too much at once.
- Open Performance Monitor, preferably on a computer that is running all of the time. You can find it in Administrative Tools or you can execute perfmon.exe from any prompt. The general recommendation is to run it on a computer other than the one that you are monitoring. If you are doing so, ensure that you run the program using credentials of an account that can log on to that computer. The two computers do not need to be running the same version or edition of Windows.
- The most meaningful performance tracking is done in the background over a long period of time, but for illustrative purposes, we’ll begin with a short real-time scan. Make sure that you are on the Performance Monitor node of the Monitoring Tools branch. In the center pane, click the button with the large green + icon or right-click on the graph and choose Add Counter:
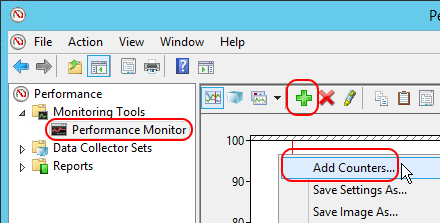
Performance Monitor – Add Counter
- If you’re going to be monitoring another computer, then the very first thing that you want to do on the Add Counters screen is target that computer. Browse to it or type a resolvable name and then [TAB] away from the field. There will be a pause while it connects to the remote computer and queries the available counters:
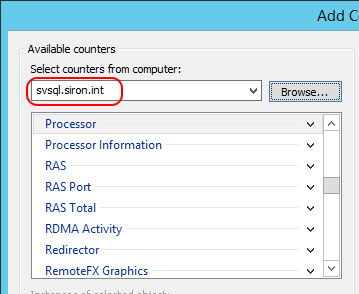
Performance Monitor – Remote Computer
- Everything that we care about for this blog post is under the Process tree (not the Processor tree). Expand that:
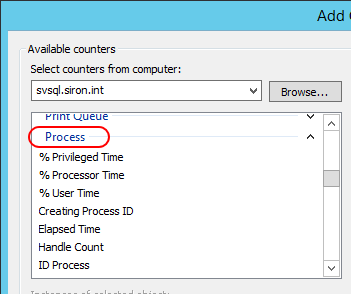
Performance Monitor – Process Group
- The next action is counter selection. Still in the Process section, scroll down to Working Set and click to highlight it. In the Instances of selected object pane directly underneath the counter pane, locate the process that you want to watch and click to highlight it. Finally, click the Add >> button so that it moves to the Added counters pane:
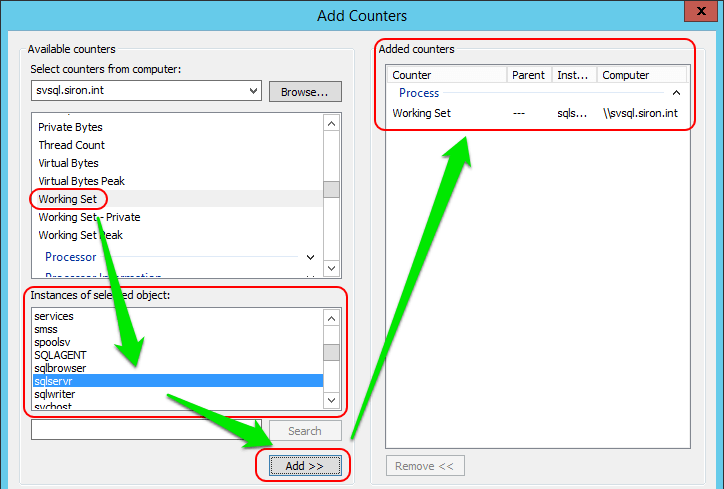
Performance Monitor – Counter Selection
- Scroll up a bit and repeat step 5 for Page faults / sec.
- Click OK. This will return you back to the main Performance Monitor window where the results of your selections should appear on the graph. In the default configuration, this display is often useless, so don’t worry if it doesn’t make any sense at first.
- Look toward the bottom of the screen, underneath the graph. You should see three line items, with each line starting with a checkbox. One of the items, probably the first, is %Processor Time for the local computer; uncheck it or right-click and choose the context menu option to remove it:

Performance Monitor – Graph Counter Items
- A reason that the graph might not make much sense is because of the Scale column. As you can see, the graph only plots from 0 to 100 — perfect for percentage counters, but not so perfect for others, such as bytes of memory. You have a few options.
- Use the digital readouts. When working with very large numbers, like byte counters, the digital readouts are often the easiest way to make sense of what you’re seeing. The negative is that you only see a very small number of data points and will miss any trends. The positive is that these numbers are completely unambiguous:

Performance Monitor – Digital Readouts
- Use the scale. Shift-click to highlight the two counters in the lower section (as seen in the preceding two screenshots), then right-click either of them and click Scale Selected Counters. Perfmon will then automatically adjust the scales of the counters so that they are not stuck all the way at the top or at the bottom (unless the counter is a solid 0). If you then divide the number on the vertical axis of the chart by the scale, you’ll have the number that’s being displayed. So, in the following screen shot, the Working Set is hovering near the 50 mark and has a scale of .0000001. 50 divided by .0000001 is 500,000,000. The digital readouts have a more precise display that shows that this is a solid estimate:
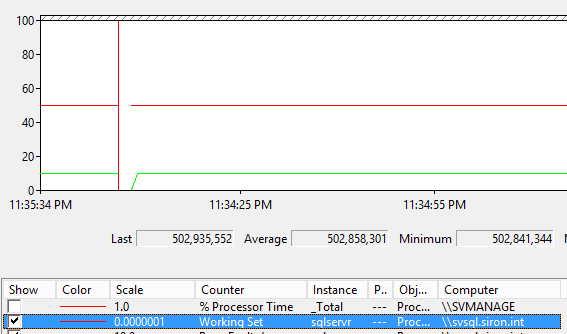
Performance Monitor – Scale
- Hover over a data point. If you just hover the mouse over a point that you’re interested in, a balloon tip will appear with all the data about that moment in time. The only negative here is that we’re in real-time mode and Performance Monitor rolls all of this data quickly.
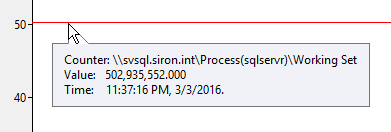
Performance Monitor – Hover Point
- Use the digital readouts. When working with very large numbers, like byte counters, the digital readouts are often the easiest way to make sense of what you’re seeing. The negative is that you only see a very small number of data points and will miss any trends. The positive is that these numbers are completely unambiguous:
You can watch your real-time display for a bit. I picked the process for a Microsoft SQL Server that has very little activity, so there’s not a lot to see here. But, watching real-time counters is not really all that helpful anyway. What you really want to do is set up a longer term watch. You can do that with Performance Monitor as well.
Using Performance Monitor to Track Performance Over Time
Bluntly, real-time performance monitoring is mostly pointless. If you really want to learn something, you need to set up something that will run long-term. Optimally, you’ll capture the target environment in multiple representative cycles. For instance, if you are profiling an accounting package, you’d want to see its performance during known busy times, such as month-end processing, and during known quiet times, such as 4 AM. Some applications go through representative cycles daily, so maybe a 24-hour watch is long enough. Generally speaking, I like to see two weeks’ worth at a minimum — preferably a month or more.
To gather statistics over time:
- In Performance Monitor, expand Data Collector Sets. Right-click User Defined and click Data Collector Set.

Performance Monitor — New Collector Set
- On the first page of the wizard, give your collector set a useful name. If you’re profiling an application on a specific server, then use those as part of the name. Select Create Manually (Advanced). Click Next.
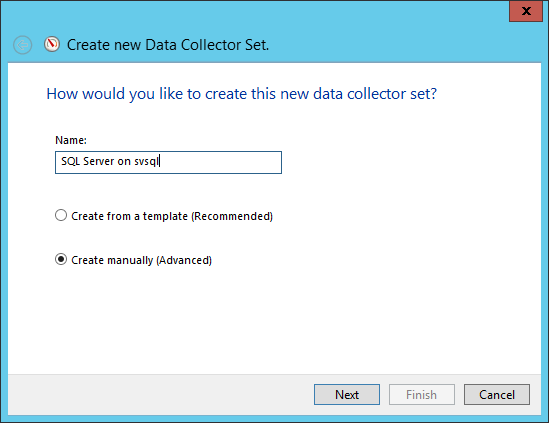
Collector Set Name
- The only data type that we’re interested in at this time is Performance counter. Check that, then click Next.
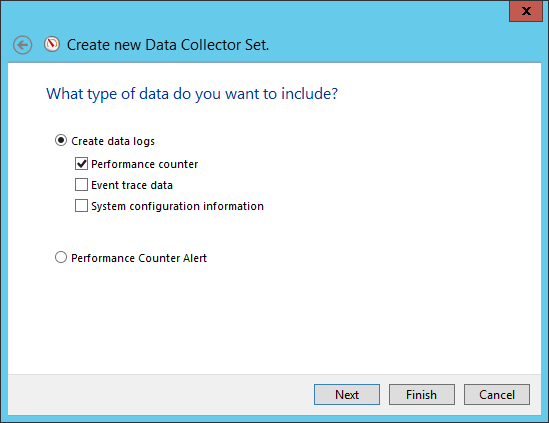
Data Collector Type
- For the counters screen, use the Add button. You’ll select counters exactly as you did in the previous set of instructions. Before moving on, check the Sample interval. 15 seconds gives a very good view of what’s going on, but could result in some very large logs. I don’t have exact numbers, but it seems that a single 15 second counter will gather about 700MB per day. If you have the space, use it. Most server applications won’t have enough variance that 15 seconds is a necessity, though. You can space the sampling out to run every few minutes, if you’d rather. Once you’re happy, click Next.
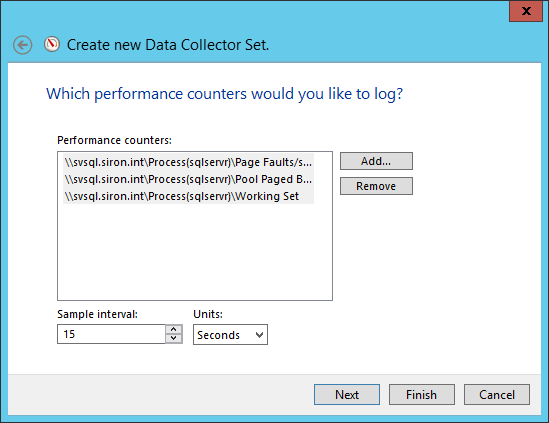
Data Collector Counters
- On the next screen, you’re asked where you want to place the logs. I didn’t screenshot that one. The default usually works well enough as you can always copy the log files if they’re needed elsewhere.
- The most important thing on the final screen is the credential set. If you’re running the gatherer against a remote system (recommended), specify credentials by clicking the Change button.
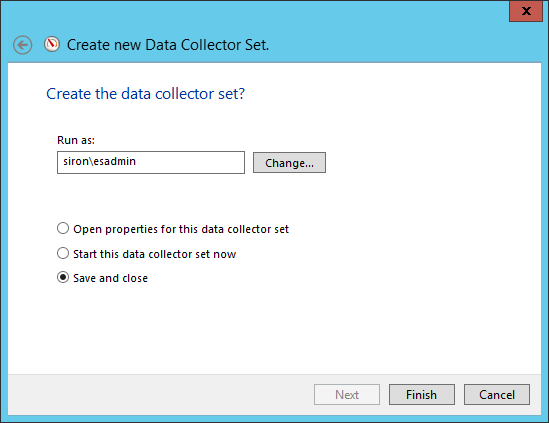
New Collector Set Final Page
There are a number of things that you can do with a collector set that I did not show you. These are on the properties dialog that the wizard asked you about opening. You can always right-click the collector set to access the property sheet, so there’s nothing lost if you didn’t do it right then and there. There is some perhaps unexpected behavior that I need to point out. Refer to this screenshot:

Performance Monitor Collector vs. Set
What you have created is a Collector Set with a single Collector. These items are different, therefore their properties are different:
- Manipulate the collector if you want to change counters and collection intervals. If you want to do something like gather data from multiple counters at different intervals, right-click on the collector set, go to New and Collector Set, and you’ll be given a shorter version of the above wizard.
- Manipulate the collector set if you want to change triggers, schedules, credentials, stop conditions, and tasks to execute when collection completes. All of these screens are self-explanatory as far as purpose, and thoroughly explaining them would take more space than I have for a single blog post. If you want to go into more detail, I would start with Microsoft’s TechNet articles on Performance Monitor.
Tip: set the counter to run for as long as you’d like to see in a single report. Start it, and then let it go. Any time that a collector set is stopped, it creates a single report that cannot be viewed alongside others. So, get everything configured the way that you want it, start the collector (or schedule it to start) and then walk away until it’s complete.
Tip: only use a single collector set per target computer. Multiple computers can be in a single set, even in a single collector, but it doesn’t take very many before collectors get sluggish and sometimes won’t even start.
When you stop a collector (or it stops on its own), it will appear under the Reports branch. You cannot view a report that is in the process of being gathered, but you can view any that have stopped.
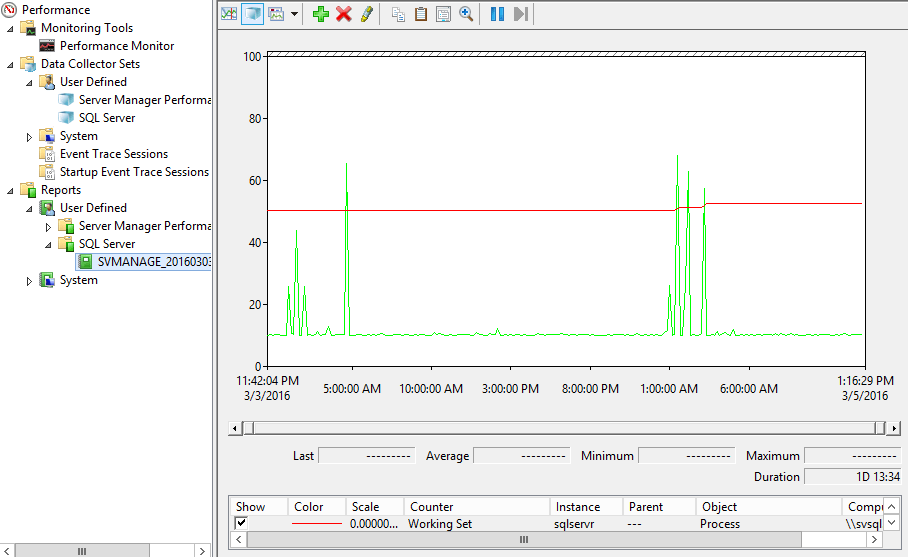
Data Collector Report
As you can see, the report here looks and behaves quite a bit like the real-time with the primary exception being… surprise! not real-time. It has definite start and end times. You can also zoom in on any section by drawing in the reports window and/or by moving the small blocks in the horizontal scroll bar, then right-clicking the region and selecting Zoom To. That’s very helpful for those long-term collections.
Guidance on Performance Monitor Counter Selection
It’s tough to know which counters to select. For process monitoring, I like:
- Working Set. This tells you how much physical memory the process is currently using. There are some caveats with this counter (you can see them by selecting the Description box in the dialog shown in step 5 in the first set of directions), but I have found those caveats to be fairly overblown.
- Page Faults/sec. This counter tells you how many times per second the process attempted to access data that it thought was in memory, but that was actually paged out to disk.
- Pool Paged Bytes. The Pool Paged Bytes counter gives you some idea of how the process is being paged. There is no guarantee that this memory is actually on disk, so do not rely heavily on this counter.
Out of all of these, the first two are the most important. Especially watch the page faults per second, as that tells you when a process does not have enough memory. In my report, my SQL server’s typical page faults were around 1 per second, which is very low and of no concern. There are some peaks in there, but they are short. Also, I can identify those times and I know that the system is working hard but no one is in and all of the related processes complete in an adequate time frame. Therefore, it is safe to conclude that the SQL Server process has sufficient memory. I do not need to increase the Startup or Minimum and my Maximum is, at worst, sufficient. Depending on what its value is, I might even consider lowering it.
There are a number of other counters in the memory section. If you’re curious, go ahead and gather them. The real expense of running Performance Monitor, especially remotely, is all in the disk space. If you can spare that, it’s better to have too much information than too little.
Sizing Method 2: Watch Environment Behavior
Within those collector sets from the previous section, I also recommend that you set up some on the guest operating system environment. Watch how much memory is in use and page faults per second. If you’re already using Dynamic Memory on the guest, you’ll find a number of very helpful memory counters from the host’s list:
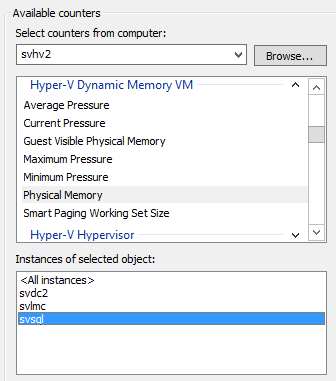
Dynamic Memory Counters
It’s good to keep an eye on Physical Memory and the various Pressure counters to determine if you have starvation trends.
Tip: If you’re using fixed memory allocation and aren’t comfortable with — or can’t use — Dynamic Memory, but would still like to have these counters available, then enable Dynamic Memory on the guest and set its Startup, Minimum, and Maximum values to the amount that you currently have allocated as fixed. For the sake of your other virtual machines, set its Buffer to zero. It will continue to behave as though it had fixed memory, but all of these counters will become available to you.
Dynamic Memory Sizing Guidelines
In truth, you will combine the application-centric and the environmental approaches. Once you have the major procedures down, there are only a few other things to keep in mind:
- Some processes are very greedy. Even if a process seems to be starved for memory, be careful how much you trust it. There are more than a few applications in the world that will suck up everything that it is given to them and complain that they need more. Some applications perform worse as their memory allocation increases because they weren’t designed for a large pool and get confused.
- Focus on user-impacting performance. If you work in a 9-5 shop and your application reports that it’s out of memory from 10 PM to 5 AM and no one notices, then don’t get in too much of a hurry to start optimizing. If it can be done at little or no cost, there’s no harm in improving things. Don’t cause problems that aren’t there.
- Determine if something is wrong. Don’t assume that the performance metrics that you’re collecting are normative. Some applications leak, others have problems that might go undetected. If something seems off, investigate it, correct it, then perform tracking for sizing purposes. Do not architect to satisfy the demands of a faulty system.
- Remember that the hypervisor environment is shared. Do not examine your guests’ performance charts in isolation. If one virtual machine trends high during periods that another trends low, they are complementary and should be treated that way. If a virtual machine seems to be starving at 2 PM, find out if another is getting greedy at 1:55 PM. That’s a problem that you can solve, with guidance from the next section.
Dynamic Memory Configuration Guidelines
The following screenshot shows the memory configuration tab of a virtual machine. I’ll reference the screen elements in this section:
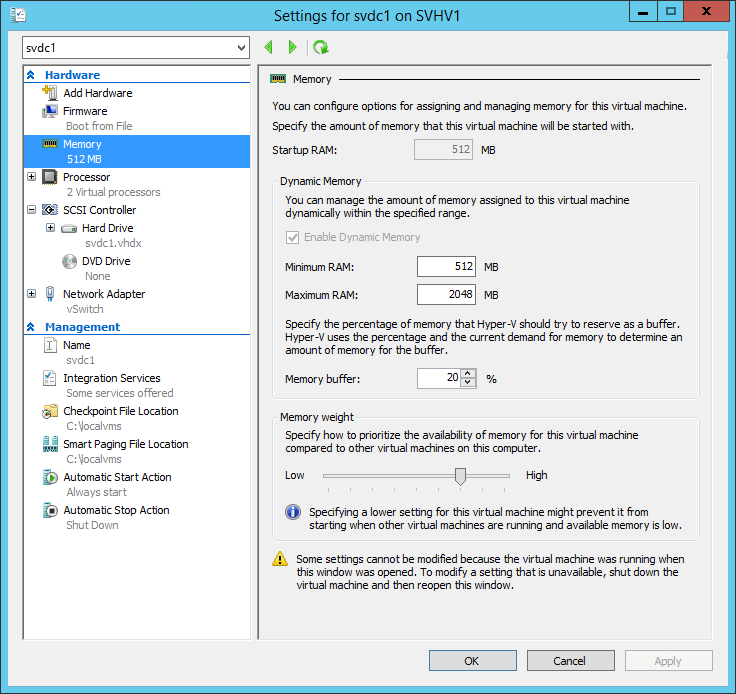
Dynamic Memory Configuration Screen
There are four major sections to this screen:
- Startup: This controls how much memory is visible to the virtual machine from the point of startup. It sets the absolute minimum amount that the virtual machine will be able to recognize. If a guest operating system does not support Dynamic Memory or if Dynamic Memory is not enabled, this is the only amount the virtual machine will ever see and memory will neither be taken from nor added to it.
- Minimum/Maximum bounds: These seem self-explanatory to me. Be aware that you can lower the minimum but not raise it while the virtual machine is on. You can raise the maximum but not lower it while the virtual machine is on.
- Memory buffer: If the memory is available, Hyper-V will set aside this quantity for Dynamic Memory expansion. The percentage is calculated against the amount of memory currently allocated to the virtual machine. So, if the buffer is 20% and the virtual machine is currently allocated 1 gigabyte, the buffer will be as high as 200 megabytes. If Dynamic Memory expands the allocation to 1.4 gigabytes, the buffer will increase to 280 megabytes.
- Memory weight: When Hyper-V needs to make memory supply decisions between contending virtual machines, it will use the Memory weight as a guide. The higher the weight, the more likely the virtual machine will receive memory. As the screen’s text notes, this can cause some virtual machines to not turn on at all. What the text doesn’t say is that such an event is always a possibility — using the weight allows you to be in charge of which virtual machines starve.
With the accumulated knowledge from above, we can set out these generic guidelines for Dynamic Memory configuration:
- If your application or operating system are struggling because they only calculate their memory consumption based on the value of total available memory at startup, use a higher Startup value while leaving the Minimum at a lower setting.
- Do not leave the Maximum at its default setting of 1 terabyte unless you have the memory available and the guest is likely to use it. A faulty application with a memory leak or a malicious application that eats up memory can cause a virtual machine to expand until all other virtual machines are compressed to their minimums. Remember that you can always increase the Maximum, even while the virtual machine is on, so it’s safer to start low.
- Watch your Performance Counters as shown above to determine an adequate Minimum value.
- If a vendor asks you to set a memory reservation, the Hyper-V equivalent is Minimum.
- While I believe that systems should be continually monitored for performance as a matter of due diligence, I also understand that it can become onerous to translate those into solid Minimum/Maximum settings. Tinkering will definitely hit a point of diminishing returns very quickly. After that, rely on Memory weight to keep your virtual machines behaving as you like rather than burn a lot of hours fine-tuning upper and lower bounds.


Not a DOJO Member yet?
Join thousands of other IT pros and receive a weekly roundup email with the latest content & updates!


