Save to My DOJO
Table of contents
Monitoring the health of your Hyper-V server should be a daily task. One area you might want to consider checking are performance counters. If you can use a little PowerShell, you’ll find this is even easier than you might imagine. I’ll be demonstrating on a PowerShell 3.0 system, but these commands should all work on PowerShell 2.0. You don’t need PowerShell remoting and you don’t even need the latest and greatest Hyper-V server.
Open a PowerShell session on your desktop with credentials that have administrator privileges on your Hyper-V server. It is always better to measure performance remotely. One counter I always check is the amount of available memory. I have limited resources so I need to be careful about how many concurrent virtual machines I can run. Let’s start with a command like this:
get-counter -counter "\memory\available mbytes" -ComputerName chi-hvr2.globomantics.local
This will get the available bytes counter on my Hyper-V server, CHI-HVR2. This is what I get back.
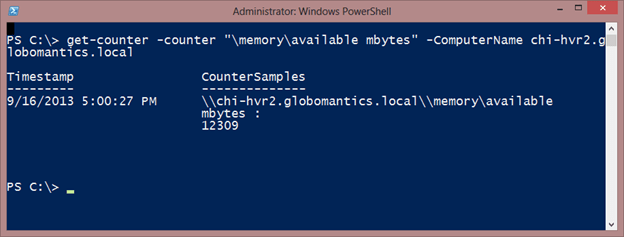
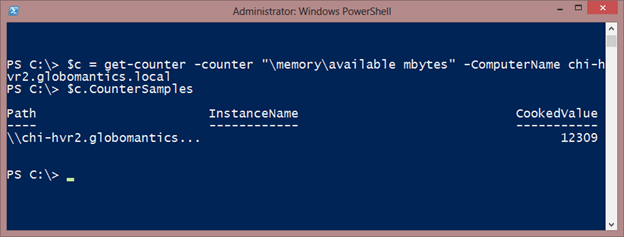
The counter sample value is in bytes and as you can tell is a little cumbersome. When you get performance data, you typically get raw and a “cooked” value. The latter is usually what you want. I can get to it by expanding the CounterSamples property which is itself an object.
$c = get-counter -counter "\memory\available mbytes" -ComputerName chi-hvr2.globomantics.local
$c.CounterSamples
Here’s my result.
Or I can get just the cooked value:
PS C:\> $c.CounterSamples.cookedValue
12309
You are probably wondering how I knew the name of this memory counter. Turns out all you need to do is know how to ask which we’ll do in a moment to find Hyper-V specific counters. Since many operating system counters, like memory, are the same across platforms, I can get names from my desktop.
get-counter -listset memory
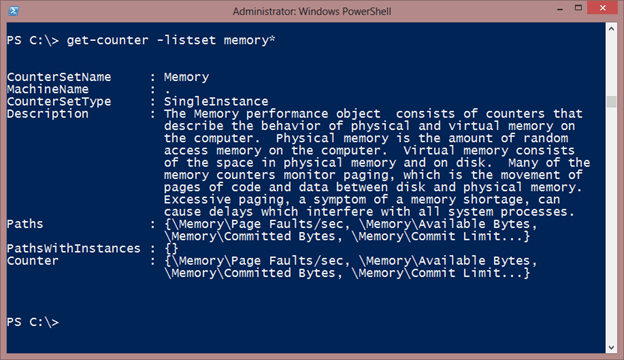
The counter property has all of the actual names you need you use.
get-counter -listset memory* | Select -ExpandProperty Counter
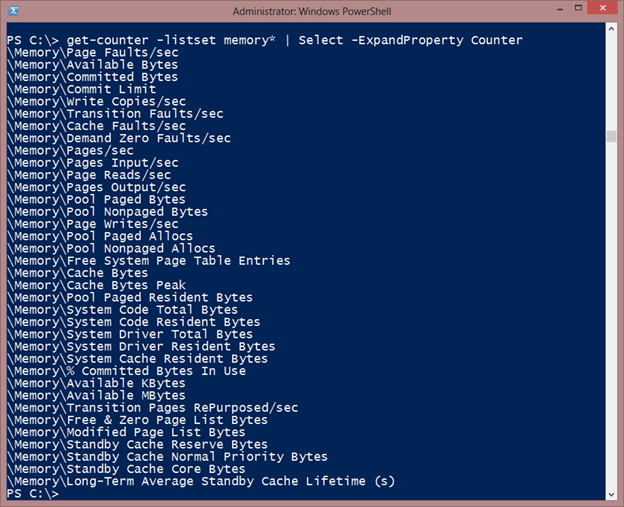
Once you know the counter names, you can ask for multiple counters with a single command.
$ctrs="\Memory\Page Faults/sec","\Memory\% Committed Bytes In Use","\Memory\Available MBytes"
Get-Counter -counter $ctrs -computername chi-hvr2.globomantics.local |
Select -ExpandProperty CounterSamples |
Select Timestamp,
@{Name="Computername";Expression={$_.path.substring(2).replace("\\","#").Split("#")[0]}},
@{Name="Counter";Expression={$_.path.substring(2).replace("\\","#").Split("#")[1]}},
CookedValue
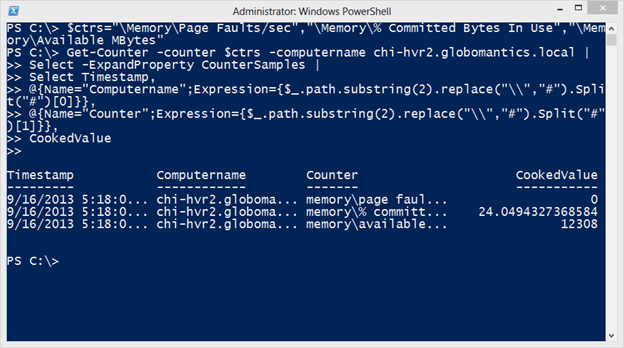
My code sample uses some custom properties to split out the computer and counter names. I wish it was easier, but unfortunately it take a little PowerShell hocus-pocus to format properly. But the results I think are worth it:
Now let’s look at Hyper-V counters. We can use the same techniques I just showed you.
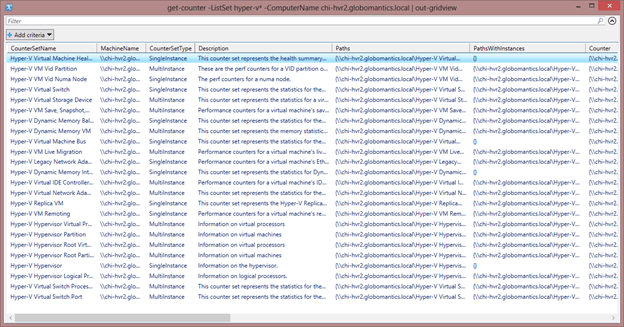
get-counter -ListSet hyper-v* -ComputerName chi-hvr2.globomantics.local | out-gridview
I piped to Out-Gridview to make it easier to see everything.
Or just ask for the counter names
PS C:\> get-counter -ListSet hyper-v* -ComputerName chi-hvr2.globomantics.local | Select Countersetname

CounterSetName
--------------
Hyper-V Virtual Machine Health Summary
Hyper-V VM Vid Partition
Hyper-V VM Vid Numa Node
Hyper-V Virtual Switch
Hyper-V Virtual Storage Device
Hyper-V VM Save, Snapshot, and Restore
Hyper-V Dynamic Memory Balancer
Hyper-V Dynamic Memory VM
Hyper-V Virtual Machine Bus
Hyper-V VM Live Migration
Hyper-V Legacy Network Adapter
Hyper-V Dynamic Memory Integration Service
Hyper-V Virtual IDE Controller (Emulated)
Hyper-V Virtual Network Adapter
Hyper-V Replica VM
Hyper-V VM Remoting
Hyper-V Hypervisor Virtual Processor
Hyper-V Hypervisor Partition
Hyper-V Hypervisor Root Virtual Processor
Hyper-V Hypervisor Root Partition
Hyper-V Hypervisor
Hyper-V Hypervisor Logical Processor
Hyper-V Virtual Switch Processor
Hyper-V Virtual Switch Port
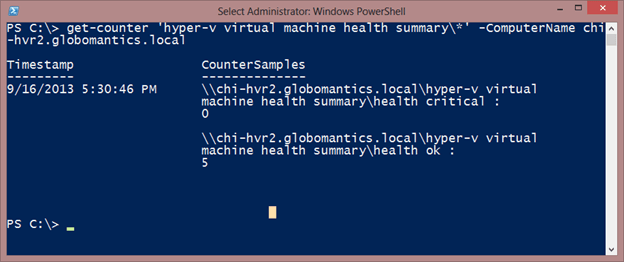
By the way, these results are for a server running Windows Hyper-V Server 2012 R2 Preview so you’re results may vary. Once you have identified the counter set name you can get performance counter data. One way is to get all counters for a set like this.
get-counter 'hyper-v virtual machine health summary\*' -ComputerName chi-hvr2.globomantics.local
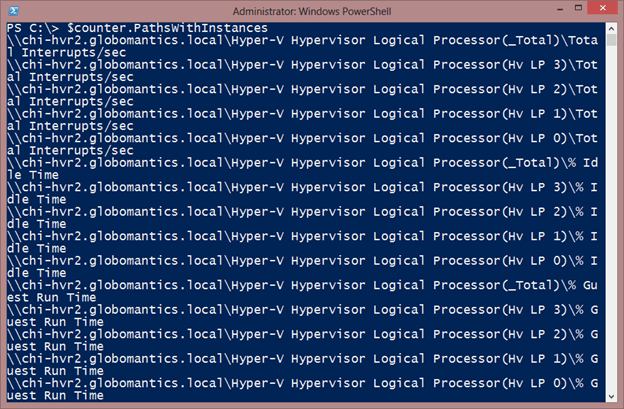
In some cases, you may have multiple instances.
$counter = get-counter -list 'hyper-v hypervisor logical processor' -ComputerName chi-hvr2.globomantics.local
$counter.PathsWithInstances
As you can see, there are many items.
But I’ll need to use an actual counter name
$counter.Counter
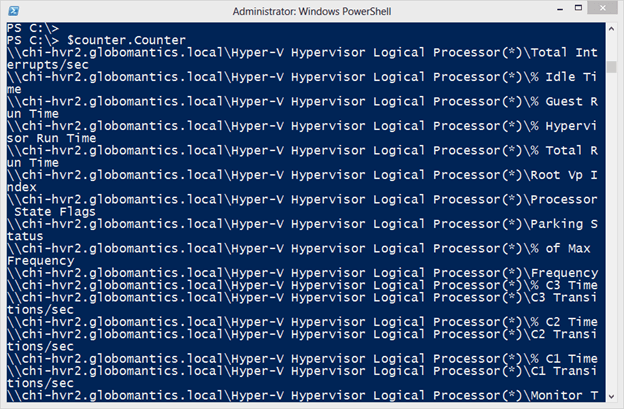
You can replace the * with an appropriate physical instance reference from one of the paths with instances. Here’s an example getting some values for aggregated processor information:
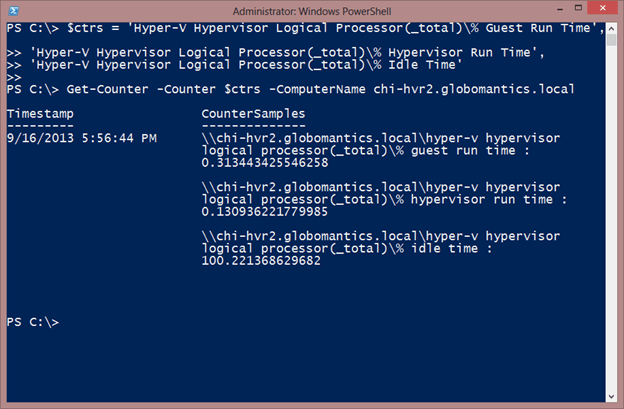
$ctrs = 'Hyper-V Hypervisor Logical Processor(_total)\% Guest Run Time',
'Hyper-V Hypervisor Logical Processor(_total)\% Hypervisor Run Time',
'Hyper-V Hypervisor Logical Processor(_total)\% Idle Time'
Get-Counter -Counter $ctrs -ComputerName chi-hvr2.globomantics.local
Get-Counter -Counter $ctrs -ComputerName chi-hvr2.globomantics.local
Here’s my result:
Or you massage the output.
Get-Counter -Counter $ctrs -ComputerName chi-hvr2.globomantics.local |
Select -ExpandProperty CounterSamples |
Select CookedValue,
@{Name="Computername";Expression={$_.path.Split("\")[2]}},
@{Name="Counter";Expression={$_.path.Split("\")[3..4] -join "\"}} |
out-gridview -Title "Hyper-V Logical Processor"
I had to tweak the code I used earlier because the format of the counter path is a little different.

Of course I have no way of knowing what particular Hyper-V counter is of interest to you, but I hope you have a better idea of how to identify the counter, retrieve the data and format it to your liking. I’ll cover some additional counters that apply to the Hyper-V guest in the next part of this series.


Not a DOJO Member yet?
Join thousands of other IT pros and receive a weekly roundup email with the latest content & updates!


