Save to My DOJO
In a previous post, I guided you through some PowerShell techniques to get, format and display Hyper-V related performance counters. The potential downside is that some of those techniques relied on additional PowerShell modules which you may not feel like installing. With that in mind let me wrap up my short course on performance counters and demonstrate how you can create a visually useful monitoring tool with nothing more than the PowerShell console. Technically, today’s code will also work in the PowerShell ISE but I think it is more effective in the PowerShell console.
Determining Average Dynamic Memory Pressure
As I have mentioned before, you can use the techniques and concepts to work with all sorts of performance counter data. The technique I want to show now works best with a single counter for a single virtual machine. I’m going to use the Average Pressure counter from the Dynamic Memory counter set for a single VM.
I’m using my local Hyper-V setup on Windows 10 but you should get the similar results for any Hyper-V host, even remote ones.
$computer = $env:COMPUTERNAME
$VMName = "SRV2"

Get-Counter "Hyper-V Dynamic Memory VM($VMName)Average Pressure" -ComputerName $computer

Verifying you can get a single instance is a good first step. Now that I know my syntax is correct, I can extend Get-Counter to provide a number of samples at a set interval.
Get-Counter "Hyper-V Dynamic Memory VM($VMName)Average Pressure" -ComputerName $computer -MaxSamples 24 -SampleInterval 5
I could use some of the techniques from the previous article. But instead, I am going to turn to a cmdlet that most people don’t use, Write-Progress.
Setting Write-Progress as Output
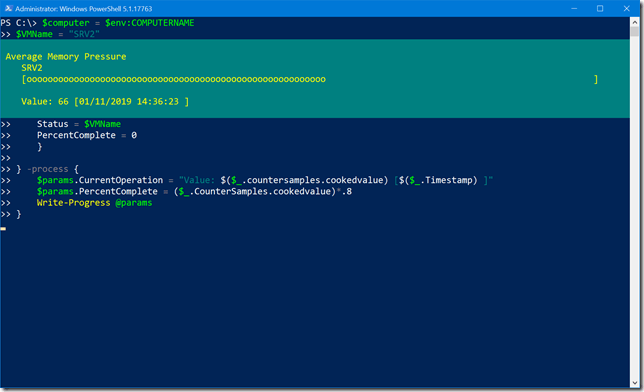
I encourage you to take a few minutes at some point to read full help and examples for the cmdlet. You’ve probably seen this cmdlet in action in some commands that take a long time to run. You see a greenish (cyan) box with a text style progress bar. It turns out that you can control the features of the progress box from PowerShell. In other words, I can dynamically adjust the percent complete value to reflect any value I want. In this case, I can use it to display the value of Average Memory Pressure performance counter.
Get-Counter "Hyper-V Dynamic Memory VM($VMName)Average Pressure" -ComputerName $computer -MaxSamples 10 -SampleInterval 3 |
foreach -begin {
    $params = @{
    Activity = "Average Memory Pressure"
    CurrentOperation = ""
    Status = $VMName
    PercentComplete = 0
    }

} -process {
    $params.CurrentOperation = "Value: $($_.countersamples.cookedvalue) [$($_.Timestamp) ]"
    $params.PercentComplete = ($_.CounterSamples.cookedvalue)*.8
    Write-Progress @params
}

PowerShell will display a live update on the Average Pressure value for virtual machine SRV2. My code snippet is updating the progress bar 10 times every 3 seconds. In order to fit in the performance counter value, especially if it gets really high, I’m displaying 80% of the value. The progress bar becomes more of a relative indicator. If I let this run long enough and the VM is stressed, I’ll see the progress bar increase and decrease as pressure ebbs.
Creating a Re-Usable Tool
With this premise in mind, I took it upon myself to create a PowerShell function that you can run at any time to get a similar display. Here it is!
Function Show-VMMemoryPressure {
[cmdletbinding(DefaultParameterSetName="interval")]
Param(
[Parameter(Position = 0, Mandatory,HelpMessage = "Enter the name of a virtual machine")]
[alias("Name")]
[string]$VMName,
[Parameter(HelpMessage = "The name of the Hyper-V Host")]
[Alias("CN","vmhost")]
[string]$Computername = $env:computername,
[Parameter(HelpMessage = "The sample interval in seconds")]
[int32]$Interval = 5,
[Parameter(HelpMessage = "The maximum number of samples",ParameterSetName="interval")]
[ValidateScript({$_ -gt 0})]
[int32]$MaxSamples=2,
[Parameter(HelpMessage = "Take continuous measurements.",ParameterSetName="continous")]
[switch]$Continuous

)

Try {
    #verify VM
    Write-Verbose "Verifying $VMName on $Computername"
    $vm = Get-VM -ComputerName $Computername -Name $VMName -ErrorAction stop
    if ($vm.state -ne 'running') {
        $msg = "The VM {0} on {1} is not running. Its current state is {2}." -f $vmname.Toupper(),$Computername,$vm.state
        Write-Warning $msg
     }
    else {
        $counterparams = @{
            Counter = "Hyper-V Dynamic Memory VM($($vm.vmname))Average Pressure"
            ComputerName = $Computername
            SampleInterval = $Interval
        }
        if ($Continuous) {
            $counterparams.Add("Continuous",$True)
        }
        else {
            $counterparams.Add("MaxSamples",$MaxSamples)
        }

        Write-Verbose "Getting counter data"
        $counterparams | Out-string | Write-Verbose
        Get-Counter @counterparams | foreach-Object {

        #scale values over 100
        $pct = ($_.CounterSamples.cookedvalue)*.8
        #if scaled value is over 100 then max out the percentage
        if ($pct -gt 100) {
            $pct = 100
        }

        $progparams = @{
            Activity = "Average Memory Pressure"
            Status = $VM.vmname
            CurrentOperation = "Value: $($_.countersamples.cookedvalue) [$($_.Timestamp) ]"
            PercentComplete = $pct
        }
        Write-Progress @progparams
        }

    } #else VM Verified
} #Try
Catch {
    Throw $_
} #Catch

}
Save a copy to a local folder and dot source the file in your PowerShell session.
. C:scriptsShow-VMMemoryPressure.ps1
To run, specify the name of a virtual machine along with the number of samples and sampling interval in seconds. The function will default to the local computer for the Hyper-V host so don’t forget to specify one if you are querying a remote machine. There is nothing in the function that requires the Hyper-V module so you can run this just about anywhere.

Scaling Out
One drawback to this function is that it can only handle a single virtual machine. However, with a little PowerShell magic, you can fire up as many PowerShell windows as you find reasonable and monitor multiple virtual machines at once. Very handy if you have a multiple monitor setup. From within PowerShell run code like this:
"dom1","srv1","srv2" |
foreach {
start "powershell" -ArgumentList "-noexit -noprofile -command &{. c:scriptsshow-vmmemorypressure.ps1;show-vmmemorypressure -vmname $_ -continuous}"
}
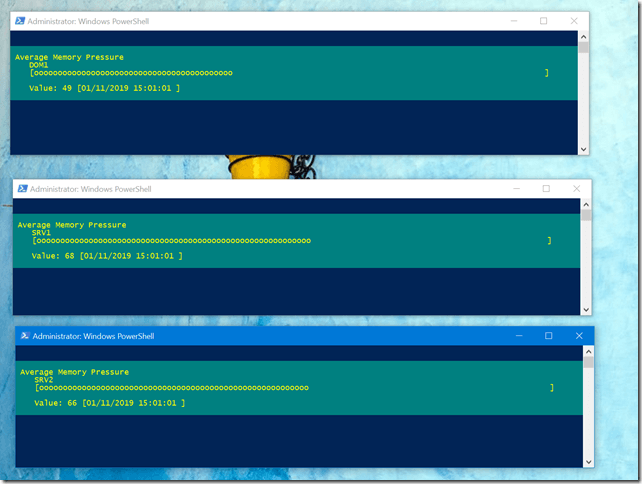
Each of the piped in names is the name of a Hyper-V virtual machine. For each name, I’m starting a new PowerShell window, dot-sourcing the script and running the function against the VM in continuous mode. After manually resizing and re-arranging the windows I now have a great look at the memory pressures on these VMs.

I can manually close the windows when I’m finishing monitoring. I wouldn’t recommend this for a large Hyper-V farm, but if you have a few VMs you need to monitor or troubleshoot this could be a useful technique.
Or you can try this variation that lets you display multiple VMs in a single Write-Progress window. I would limit this to no more than 3 VMs in the console or maybe 4 if using the PowerShell ISE. As before you need to dot source the script file first.
#requires -version 5.0
#requires -runasAdministrator
#requires -module Hyper-V

#use max of 3 VMS in the console. You may also need to resize the console window.
#use max of 4 VMs in the ISE

#Show-MemoryPressureProgress
Function Show-VMMemoryPressure {

    [cmdletbinding(DefaultParameterSetName = "interval")]
    Param(
        [Parameter(Position = 0, Mandatory, HelpMessage = "Enter the name of a virtual machine.")]
        [alias("Name")]
        [string[]]$VMName,
        [Parameter(HelpMessage = "The name of the Hyper-V Host")]
        [Alias("CN", "vmhost")]
        [string]$Computername = $env:computername,
        [Parameter(HelpMessage = "The sample interval in seconds")]
        [int32]$Interval = 5,
        [Parameter(HelpMessage = "The maximum number of samples", ParameterSetName = "interval")]
        [ValidateScript( {$_ -gt 0})]
        [int32]$MaxSamples = 2,
        [Parameter(HelpMessage = "Take continuous measurements.", ParameterSetName = "continous")]
        [switch]$Continuous,
        [switch]$ClearHost
    )

    DynamicParam {
        if ($host.name -eq 'ConsoleHost') {

            #define a collection for attributes
            $attributes = New-Object System.Management.Automation.ParameterAttribute
            $attributes.Mandatory = $False
            $attributes.HelpMessage = "Enter a console color"
            $attributeCollection = New-Object -Type System.Collections.ObjectModel.Collection[System.Attribute]
            $attributeCollection.Add($attributes)

            #define the dynamic param
            $dynParam1 = New-Object -Type System.Management.Automation.RuntimeDefinedParameter("ProgressBackground", [system.consolecolor], $attributeCollection)
            $dynParam1.Value = $host.PrivateData.ProgressBackgroundColor

            #define the dynamic param
            $dynParam2 = New-Object -Type System.Management.Automation.RuntimeDefinedParameter("ProgressForeground", [system.consolecolor], $attributeCollection)
            $dynParam2.Value = $host.PrivateData.ProgressForegroundColor

            #create array of dynamic parameters
            $paramDictionary = New-Object -Type System.Management.Automation.RuntimeDefinedParameterDictionary
            $paramDictionary.Add("ProgressBackground", $dynParam1)
            $paramDictionary.Add("ProgressForeground", $dynParam2)

            #use the array
            return $paramDictionary

        } #if consolehost
    } #close DynamicParam

    Begin {
        $counters = @()
        $vmhash = @{}
        $j = 0

        if ($ClearHost) {
            Clear-Host
        }

        #limit number of VMs
        if ($host.name -eq 'ConsoleHost') {
            $max = 3

            if ($PSBoundParameters.ContainsKey("ProgressBackground")) {
                $savedbg = $host.PrivateData.ProgressBackgroundColor
                 $host.PrivateData.ProgressBackgroundColor = $PSBoundParameters.ProgressBackground
                  Write-Verbose "Using progress background color $ProgressBackground"
            }
            if ($PSBoundParameters.ContainsKey("ProgressForeground")) {
                $savedfg = $host.PrivateData.ProgressForegroundColor
                $host.PrivateData.ProgressForegroundColor = $PSBoundParameters.ProgressForeground
                Write-Verbose "Using progress foreground color $Progressforeground"
            }

        }
        elseif ($host.name -match "ISE") {
            $max = 4
        }
    } #begin

    Process {
        foreach ($item in $VMName[0..($max - 1)]) {
            Try {

                Write-Verbose "Verifying $item on $Computername"
                $vm = Get-VM -ComputerName $computername -Name $item -ErrorAction stop
                if ($vm.state -ne 'running') {
                    $msg = "The VM {0} on {1} is not running. Its current state is {2}." -f $item.Toupper(), $Computername, $vm.state
                    Write-Warning $msg
                }
                else {
                    Write-Verbose "Adding VM data"
                    $counters += "Hyper-V Dynamic Memory VM($($vm.vmname))Average Pressure"
                    #create a hash with VMNames and a number for their progress id
                    $j++
                    $Vmhash.Add($vm.vmname, $j)
                }

            } #Try
            Catch {
                Write-Warning $_.exception.message

            } #Catch
        } #foreach item

        if ($counters.count -gt 0) {

            $counterparams = @{
                Counter          = $counters
                ComputerName     = $Computername
                SampleInterval   = $Interval
                pipelinevariable = "pv"

            }
            if ($Continuous) {
                $counterparams.Add("Continuous", $True)
            }
            else {
                $counterparams.Add("MaxSamples", $MaxSamples)
            }

            Write-Verbose "Getting counter data"
            $counterparams | Out-String | Write-Verbose

            Get-Counter @counterparams | ForEach-Object {
                $_.countersamples | Sort-Object -property Instancename |
                    Group-Object -property instancename | ForEach-Object {

                    #scale values over 100
                    $pct = ($_.group.cookedvalue) * .8
                    #if scaled value is over 100 then max out the percentage
                    if ($pct -gt 100) {
                        $pct = 100
                    }

                    $progparams = @{
                        Activity         = $_.Name.ToUpper()
                        Status           = $($pv.Timestamp)
                        CurrentOperation = "Average Pressure: $($_.group.cookedvalue)"
                        PercentComplete  = $pct
                        id               = $vmhash[$_.Name]
                    }

                    Write-Progress @progparams

                } #for each value
            } #foreach countersample
        } #if counters
    } #process

    End {
        #set private data values back
        if ($savedbg) {
            $host.PrivateData.ProgressBackgroundColor = $savedbg
        }
        if ($savedfg) {
            $host.PrivateData.ProgressForegroundColor = $savedfg
        }
    } #end
} #close function
This version of the function will require the Hyper-V module and it needs to be run in an elevated session. In the PowerShell ISE you get output like this:

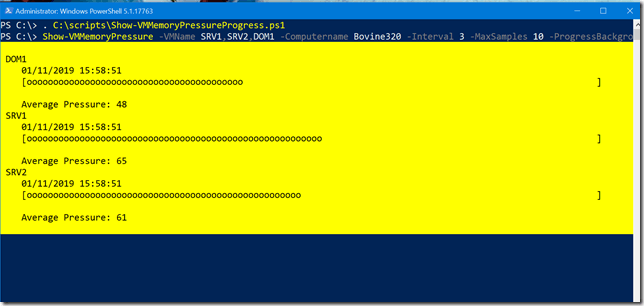
In addition to being able to specify multiple virtual machines, when you run in the console you can also specify a color scheme for the progress bar. If you don’t, then you get the defaults.
. C:scriptsShow-VMMemoryPressureProgress.ps1
Show-VMMemoryPressure -VMName SRV1,SRV2,DOM1 -Computername Bovine320 -Interval 3 -MaxSamples 10 -ProgressBackground yellow -ProgressForeground black

If you don’t see the progress bar for all the virtual machines you might need to resize your console window. For a typical PowerShell console window, I think 3 VMs should work just fine. If you run larger windows and need to see more VMs you can modify the code.
In any event, I now have a performance monitoring tool built in PowerShell that doesn’t require anything special.
What About You?
What do you think? Is this something you might use or take as a jumping off point for your own project? I’d love to hear what you think. By the way, if you are a beginner PowerShell pro looking to learn more about scripting, take a look at my PowerShell course Learn PowerShell Scripting in a Month of Lunches. If you have a bit more PowerShell experience and looking to improve your scripting game then I’d recommend The PowerShell Scripting and Toolmaking Book. Or find me on Twitter for additional tips and suggestions.
Until next time, keep pushing the limits of what you can do to manage Hyper-V with PowerShell.


Not a DOJO Member yet?
Join thousands of other IT pros and receive a weekly roundup email with the latest content & updates!


